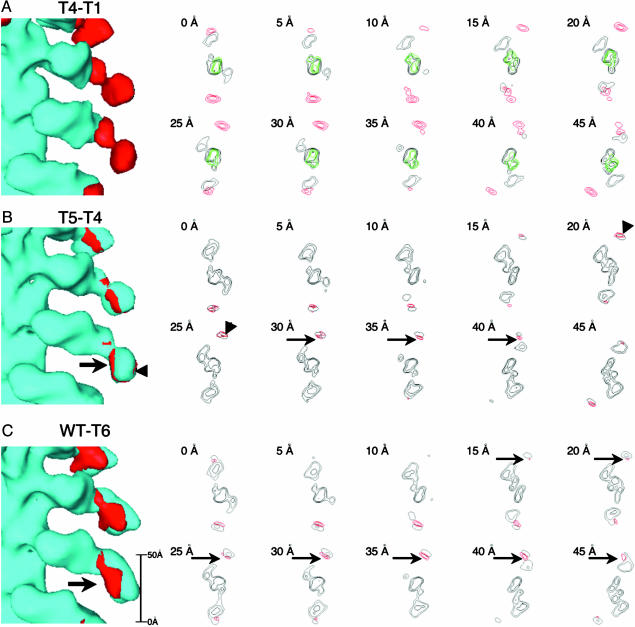
Fig. 3.
Difference densities mapped on surface renderings and in horizontal sections. (A) The difference between T4 and T1 (red) is overlaid on the T1 reconstruction (light blue). The density of actin (34) is shown in green. (B)T5–T4 overlaid on T4. (C)WT–T6 overlaid on T6. In B and C, extra density that we interpret as being GPA1-associated is marked by arrows in B: enhanced density on the other side of BR (arrowheads) is interpreted as an ordering effect.

