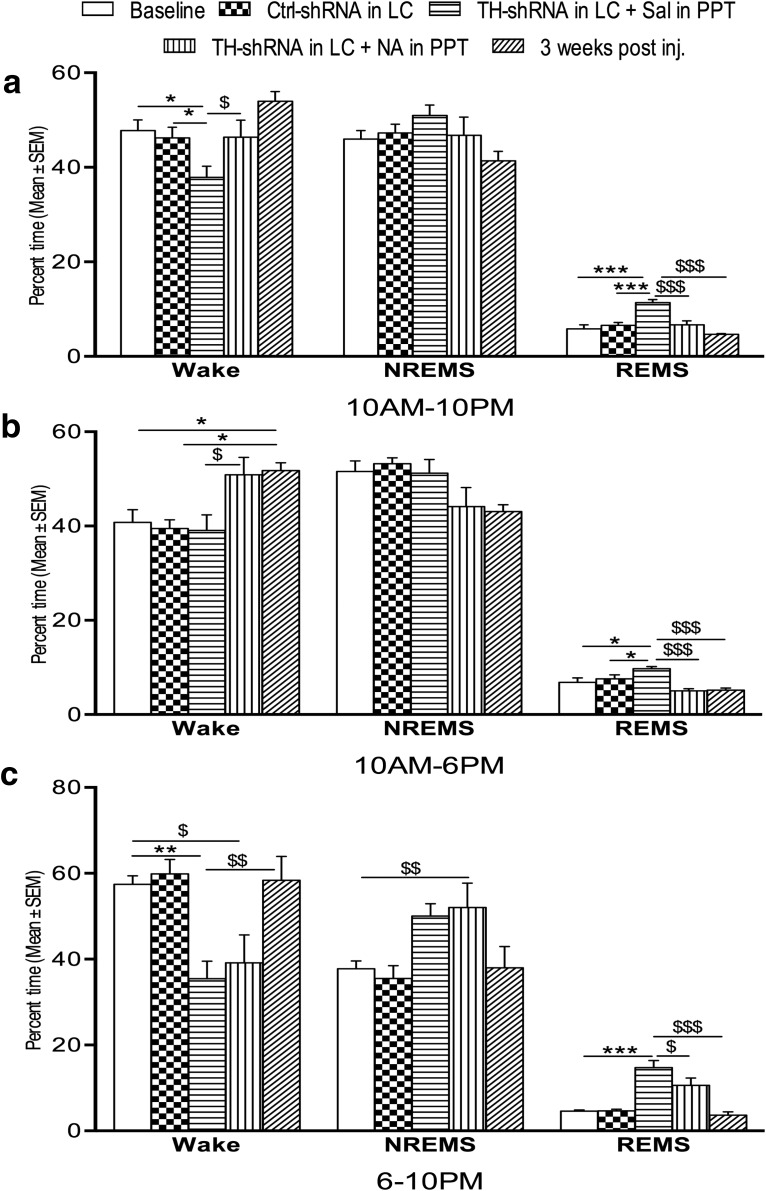
Figure 4.
Percentage (±SEM) of total recording time spent in waking state, NREMS, and REMS 8 d after TH-shRNA or Ctrl-shRNA microinjection into the LC and Sal or NA microinjection into the PPT (on the day of recording), and 21 d after TH-shRNA microinjection. a–c, The histograms show analyses of total recording periods of 12 h (10:00 A.M. to 10:00 P.M.; a), 8 h (10:00 A.M. to 6:00 P.M.; b), and 4 h (6:00 to 10:00 P.M.; c). Abbreviations are as in the text. *Compared with baseline values and Ctrl-shRNA injection; $compared with TH-shRNA injection into LC and NA injection into PPT or 3 weeks after the injection of TH-shRNA into LC. Significance level: ***p < 0.001; **p < 0.01; *p < 0.05; N = 6.

