
Figure 2. KLHL3S433 phosphorylation results in increased WNK4 levels, stimulating SPAK/NCC pathway in the kidney of mice on a low-K+ diet.
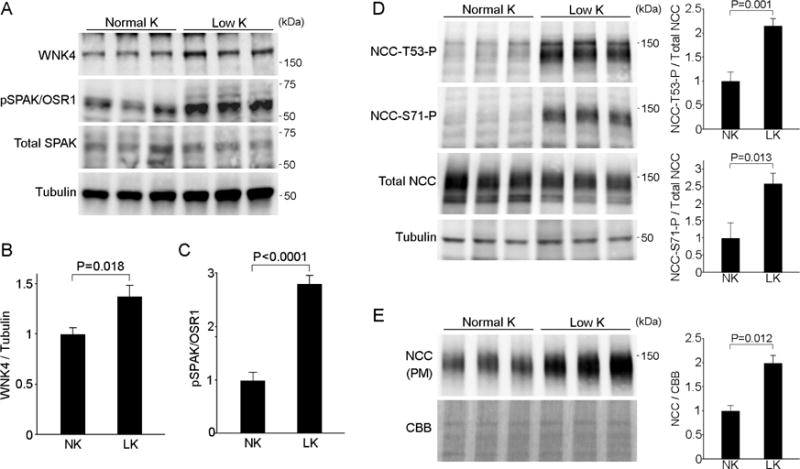
(A) Effects of low K+ diet on WNK4 levels and SPAK/OSR1 phosphorylation in the kidney. Blots show biological replicates. (B and C) Quantitation of WNK4 levels and SPAK/OSR1 phosphorylation levels described in (A). Data are expressed as means ± SEM; n = 7 for (B) and n = 5 for (C). (D) Effects of low-K+ diet on NCC phosphorylation at Thr53 and Ser71, and total NCC levels in whole cell lysates in the kidney. Blots show biological replicates. Bar graphs show the results of quantitation (n = 5 each group). (E) Expression of NCC in the plasma membrane fraction in the indicated animals (n = 3). Bar graphs show the results of quantitation. Data are expressed as means ± SEM.