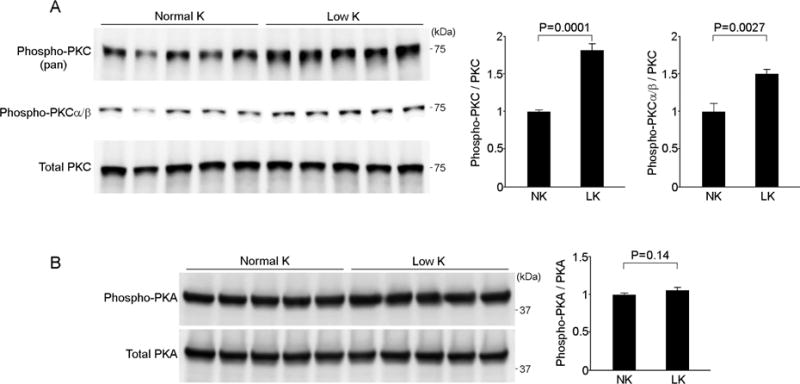
Figure 3. Low-K+ diet increases protein kinase C activity in the kidney.

(A) The effects of K+ depletion on protein kinase C (PKC) phosphorylation in the kidney. The top panel shows active, phosphorylated PKC (pan) levels. The middle panel shows the levels of active, phosphorylated PKCα/β. The bottom panel shows the total PKC levels. Blots show biological replicates. Bar graphs show the results of densitometric quantitation. Data are expressed as means ± SEM; n = 5 each group. (B) The effects of K+ depletion on protein kinase A (PKA) phosphorylation in the kidney. Blots show biological replicates. Bar graphs show the results of densitometric quantitation. Data are expressed as means ± SEM; n = 5 each group.
