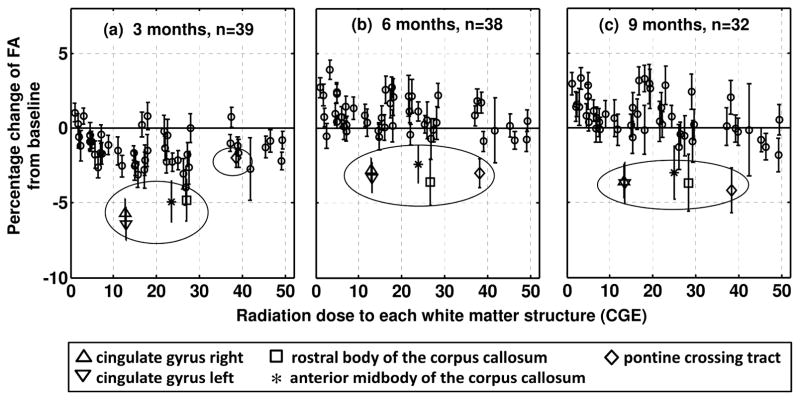
Fig. 2.
Average percentage change of FA in the 51 white matter structures plotted against the average dose. The three plots respectively correspond to different longitudinal times from baseline (3, 6, and 9 months). The structures showing persistent reductions (greater than 3%) at 9 months are presented by unique symbols and marked by a circle. The error bars represent standard error of the mean.

