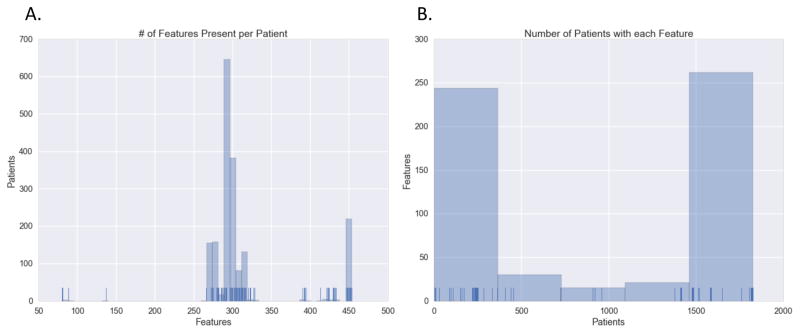
Figure 3.
Histogram distribution and rug plot showing the number of patients each feature is present in. (a) The number of features each patient has. Ticks at the bottom indicate one patient with the count of features, bins indicate the number of patients in a range. (b) The number of patients having a recorded value for each feature. Ticks at the bottom indicate the number of patients a feature is present in, bins indicate the number of features in a range.

