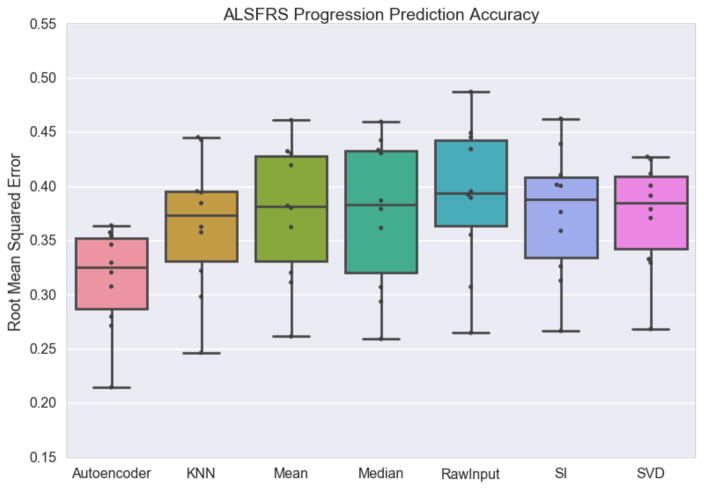
Figure 6.
ALS Functional Rating Scale prediction accuracy shown for an autoencoder, k-nearest neighbors, mean averaging, median averaging, the raw input including missing values, soft impute and singular value decomposition. The box indicates inner quartiles with the line representing the median; the whiskers indicate outer quartiles excluding outliers.

