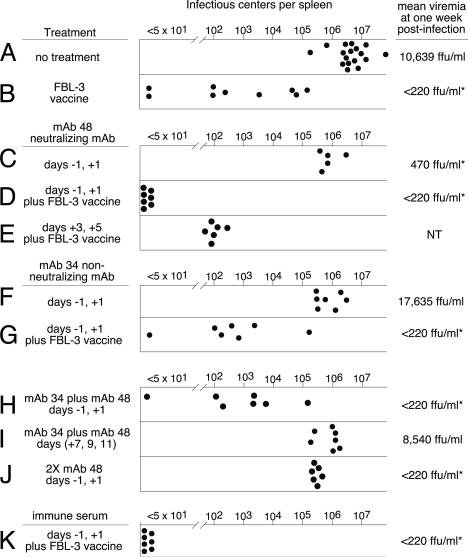
Fig. 3.
The effects of treatment on infection in B6.UMT mice. Each circle represents the results from a single mouse. For ease of comparison, 2-week data from Fig. 2 are included. Viremia results are log3 geometric means expressed as ffu/ml of plasma. The asterisks indicate significant differences in viremia from the no-treatment group (P < 0.05 by ANOVA). Passive antibody transfers were done on the indicated days relative to infection with FV. Vaccines were administered 1 month before FV infections. Groups H and I received a combination of mAb 34 and mAb 48, each at the normal dose. Group J received twice the normal dose of mAb 48 per injection. Statistical analyses were done by using Student's t test with Bonferroni correction where applicable. Groups C and F had significantly lower (P < 0.05) IC levels than did group A, and group D had significantly lower levels than did groups B and E. Group K received 0.5 ml of neat immune serum as described in Materials and Methods.

