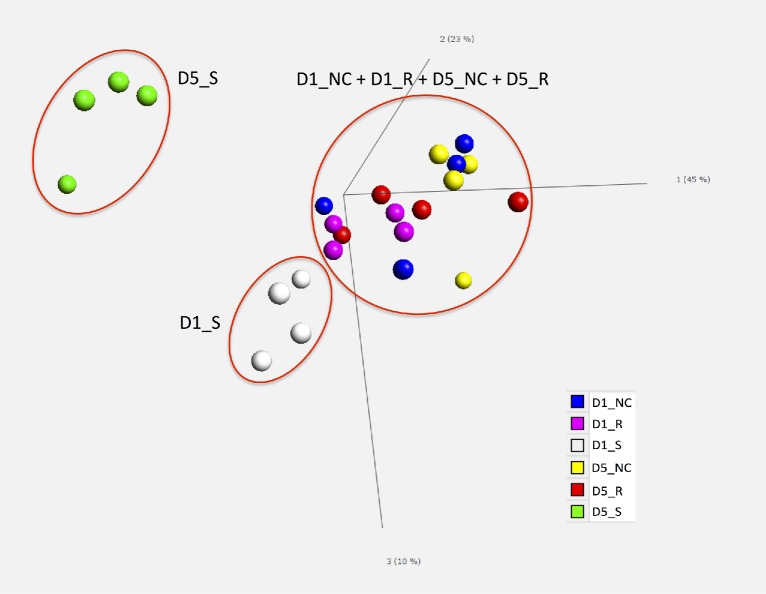
Figure 3.
Principal component plot. Across the entire data set of differentially expressed genes, principal component analysis (PCA) was used to test the spatial distribution of the 6 treatment groups. Different colors are used to illustrate each treatment group. D1_NC, 1 d post infection (dpi) non-challenged birds; D1_R, 1 dpi resistant birds; D1_S, 1 dpi susceptible birds; D5_NC, 5 dpi non-challenged birds; D5_R, 5 dpi resistant birds; D5_S, 5 dpi susceptible birds.

