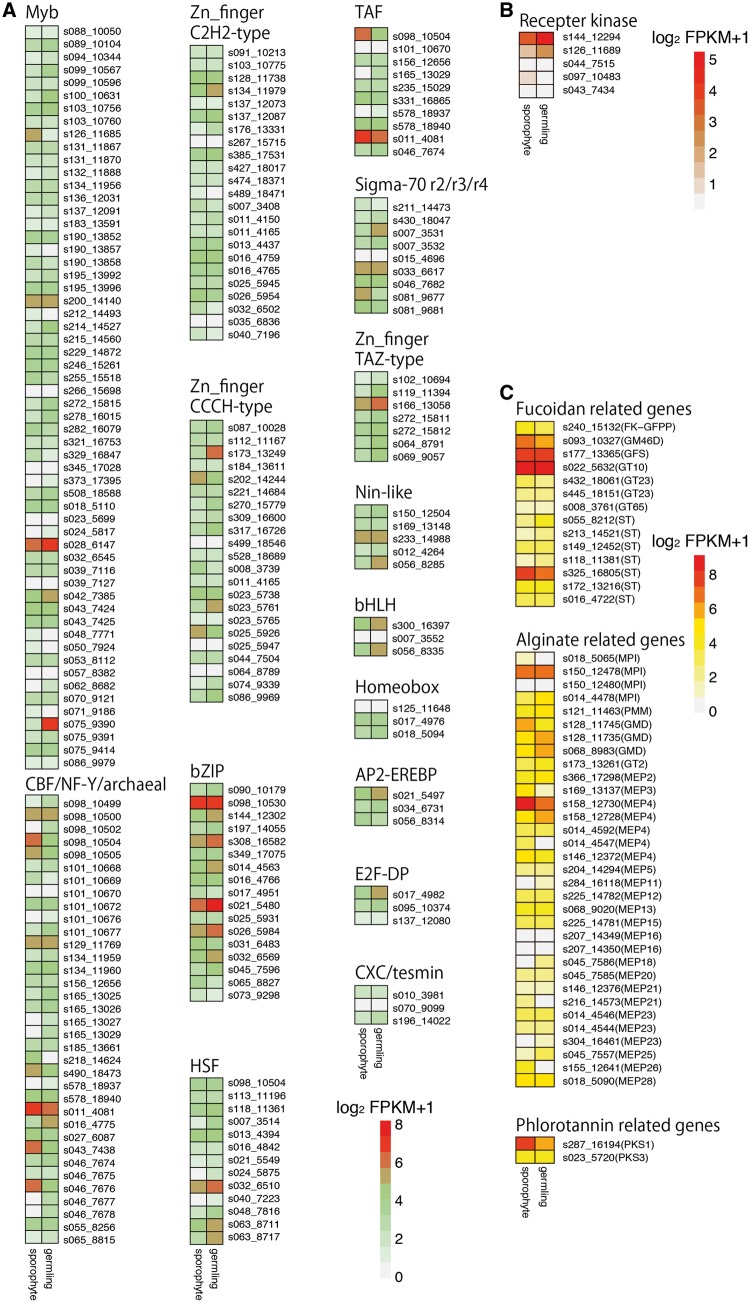
Figure 2.
Heat maps compared with gene expression levels of germlings and sporophytes of Cladsiphon okamuranus based on FPKM values. Gene IDs for the genome browser are indicated by sXXX_XXXXX. (A) Expression levels of transcription factors shown in Table 2. (B) Expression levels of receptor kinase genes shown in Supplementary Fig. S2. (C) Expression levels of C. okamuranus genes potentially contributing to biosynthetic pathways of sulfated fucans, alginates, and phlorotannin shown in Figs. 3- -5 and Supplementary Table S3.

