Fig. 1.
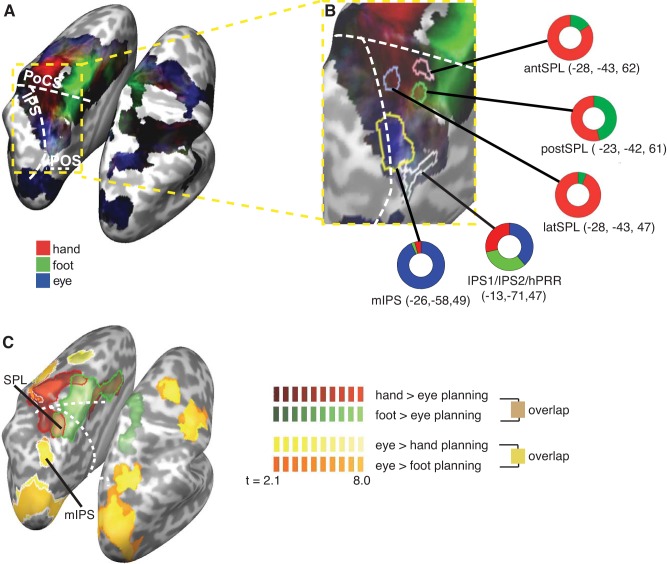
Frontal and parietal blood oxygenation level-dependent (BOLD) activation during motor planning for eyes, right hand, and right foot: gradient maps. A: comparison of the relative contribution of the β weights of the eyes (blue), hand (red), and foot (green) to explaining the BOLD signal during the planning phase. The brightness of the colors indicates the overall sum of the β weights, with brighter coloring indicating higher β weights (that is, “stronger” activation). The white dashed lines indicate the sulci. PoCS, postcentral sulcus; IPS, intraparietal sulcus; POS, parietooccipital sulcus. B: enlarged view of the area indicated by the yellow outline in A. Colored outlines demarcate the regions of interest (ROIs) we analyzed in the present study (see methods and Fig. 2, A and C, for their definitions). The colored rings visualize the relative size of the β weight of each effector in the respective ROI. antSPL, anterior superior parietal lobule (SPL); postSPL, posterior SPL; latSPL, lateral SPL; hPRR, homologue of the macaque parietal reach region in humans; mIPS, middle part of the IPS. C: activation maps for eye, hand, and foot pointing. Maps show the contrasts hand > eye planning (red), foot > eye planning (green), eye > hand planning (yellow), and eye > foot planning (orange). Maps are thresholded using a cluster threshold, with strong colored borders (red, green, and white) indicating regions that remain significant in the left hemisphere. Because the contrasts of eye > hand/foot planning are virtually identical, the result of the eye > foot planning contrast (orange) are largely obscured by the eye > hand planning contrast (yellow). Sulci are as in A.

