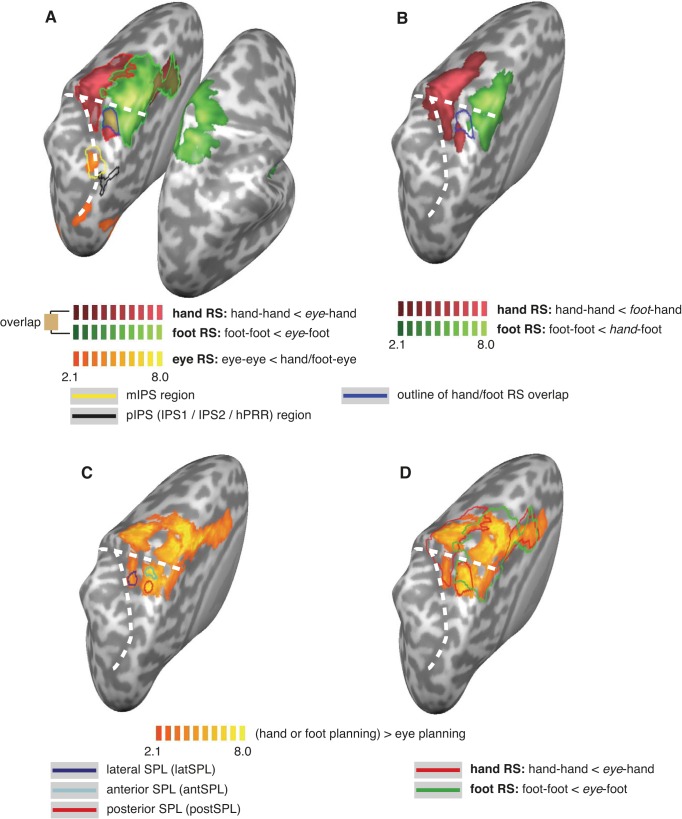
Fig. 2.
Activation maps for repetition suppression analysis. A: repetition suppression (RS) effects between the eyes and limbs, displayed as activation maps of contrasts hand-hand < eye-hand (red), foot-foot < eye-foot (green), and eye-eye < (hand or foot)-eye (orange). Bold colored borders indicate regions that survived cluster thresholding. The yellow outline indicates the region activated by eye > hand planning (see Fig. 1C). The black outline indicates the region near posterior parietal cortex (PPC) regions IPS1 and IPS2 that was activated by planning for all three effectors (see Fig. 1B). Brown coloring with dark blue border indicates hand and foot RS overlap. B: RS effects between the hand and foot, displayed as activation maps of contrasts hand-hand < foot-hand (red) and foot-foot < hand-foot (green). The cyan outline reproduces the eye-related hand and foot RS overlap from A. C: definition of ROIs. Activation for hand and foot versus eye planning is shown in yellow. ROIs were defined around the peaks of this contrast: latSPL (blue), antSPL (dark blue), and postSPL (red). D: same contrast as in C, but overlaid with the outline of the RS contrasts from A. Note that the ROI defined in C spatially coincide with the hand RS regions and hand/foot RS overlap region, although they are defined independently.

