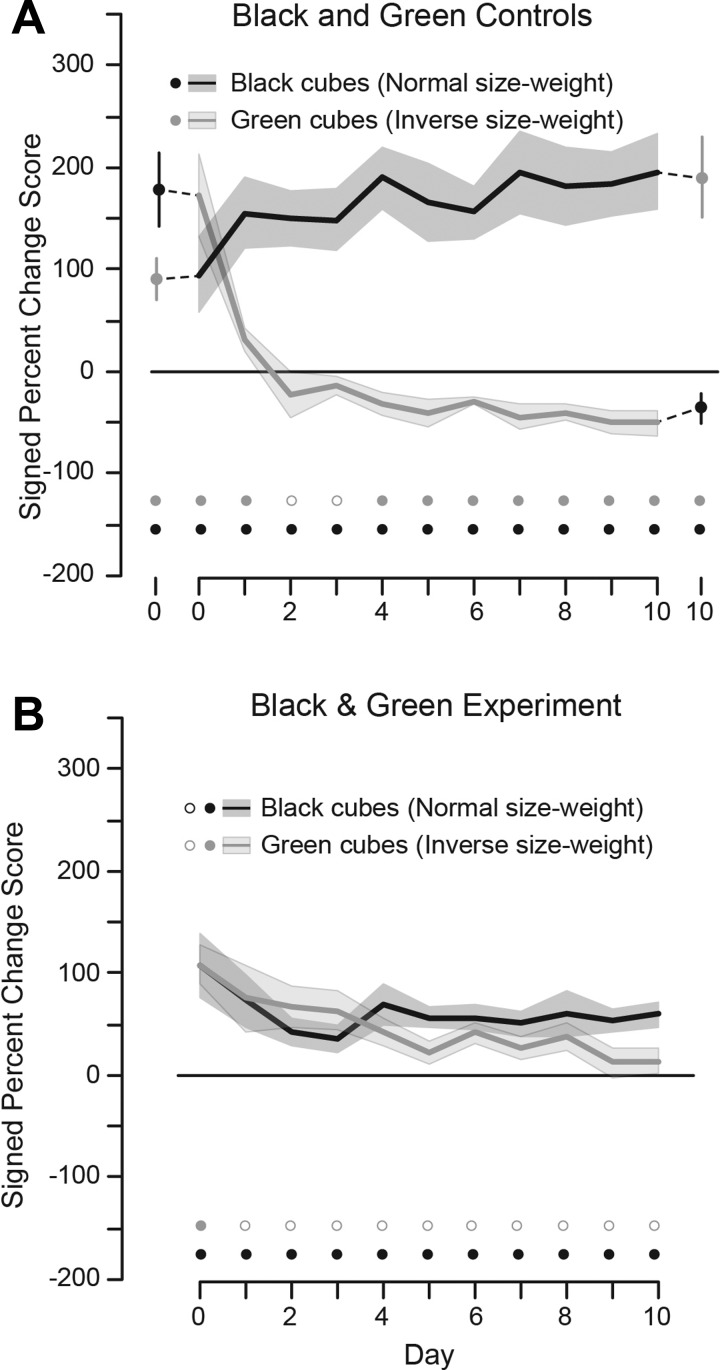
Fig. 2.
Perceptual results—experiment 1. A: signed percent change scores as a function of day for the black and green control cubes tested on days 0–10. The additional testing points within the control conditions are a result of testing the illusion with the alternate colored cubes. B: signed percent change scores as a function of day for the black and green experiment cubes. The height of each vertical bar and the shaded regions represent ±1 SE. Scores were calculated by determining the percent increase from the smallest to the largest numerical values and assigning a positive sign to this number if the small object was perceived as heavier and a negative sign if the larger object was perceived as heavier. The gray and black circles along the bottom indicate whether the green and black illusions were significantly different from 0 (filled circle), based on t-tests. A P value of 0.05 was considered statistically significant for all tests.

