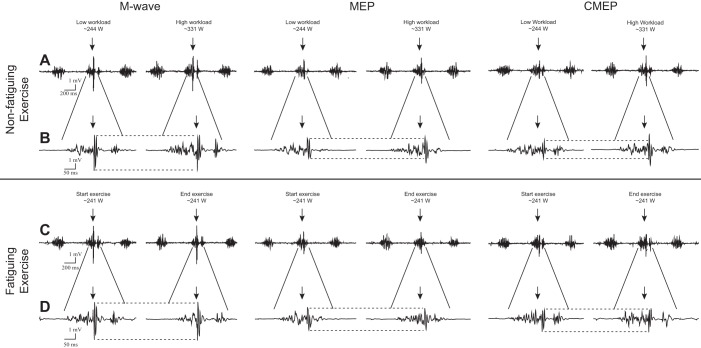
Fig. 3.
Representative raw electromyographic responses (M wave, MEP, and CMEP) in the vastus lateralis during the low- and high-workload bouts of the nonfatiguing cycling trial (A and B) and at the start and end of the fatiguing cycling trial (C and D). Arrows and dotted lines represent the point of stimulation and size of the initial response, respectively. B and D represent a ×4 magnification Y-axis view for individual responses depicted in A and C, respectively. Note that M waves were unchanged across each protocol. MEPs and CMEPs increased from the low to high workload in the nonfatiguing trial but remained unchanged during the fatiguing trial.

