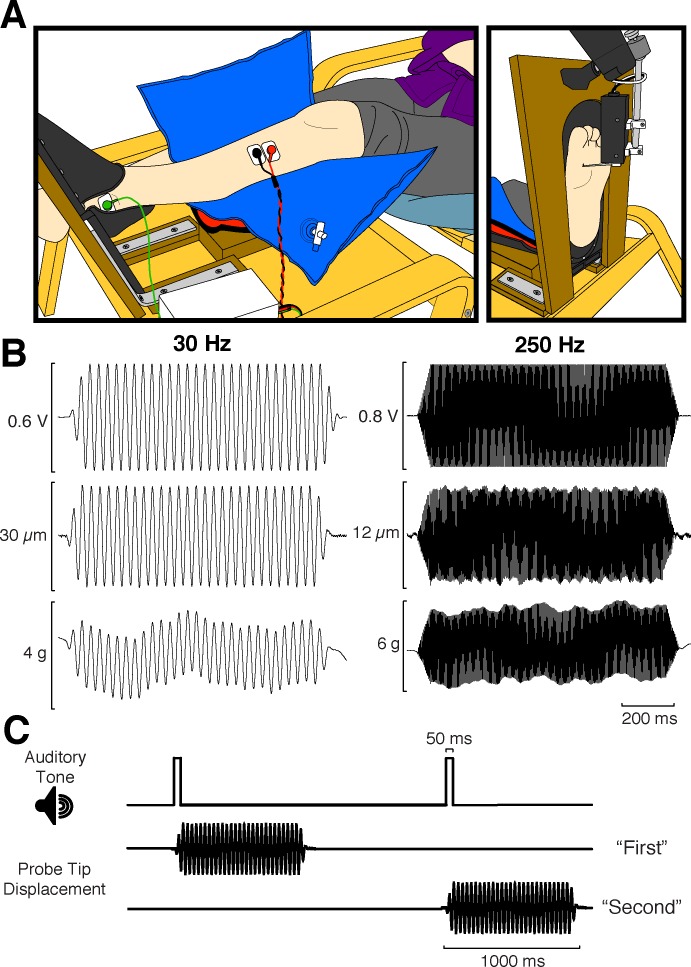
Fig. 1.
Experimental setup, vibratory stimuli, and 2IFC trial timeline. A: side schematic view of a participant's leg in the footrest/leg support setup (left) and front view of the exposed plantar surface of the foot, as well as the motor used for delivering vibrations (right). B: sample traces of 30-Hz (left) and 250-Hz vibrations (right). Top, voltage command sent to the motor; middle, probe tip displacement; bottom, contact force. C: timeline depicting the series of events that occurred on each 2IFC vibrotactile trial. The participant was presented with sequential 50-ms auditory tones denoting the 2 stimulus intervals. A 1-s vibration was delivered randomly during either the first or second interval, and the participant was required to determine which interval contained the stimulus.

