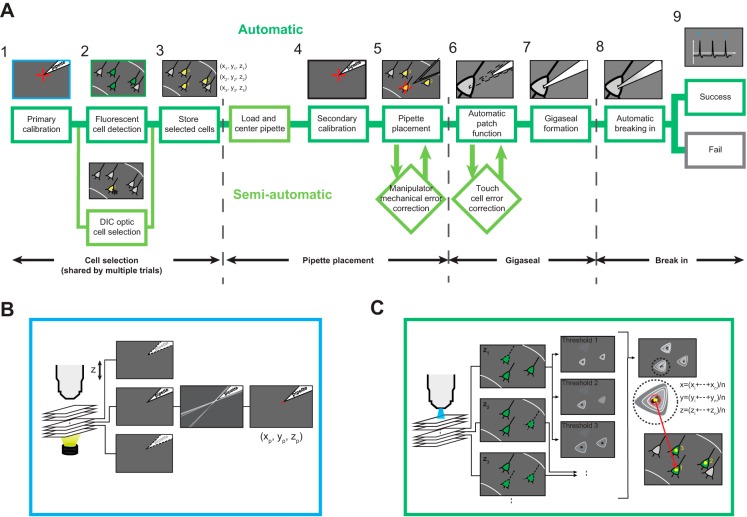
Fig. 1.
Automated image-guided in vitro patch-clamp workflow. A: steps in an automated in vitro patch-clamp experiment. 1, Primary calibration is done automatically through computer vision (also see B). 2, Target cell selection is then done using either mouse clicks (bottom) or automatic fluorescent cell detection (top; algorithm explained in detail in C). 3, Selected cell coordinates are stored for further patching (subscripts indicate the cell identification no.). 4, This is followed by a pipette calibration step that determines the coordinates of the patch pipette with micrometer-scale accuracy and resolution (indicated by red crosshairs). 5, With the coordinates of the pipette tip and target neuron determined, a pipette guidance algorithm determines the trajectory to be taken by the pipette and automatically guides the pipette to the targeted cells. 6–8, The patch algorithm (also see Fig. 6 for detailed algorithm flowchart) is then initiated, which uses pipette impedance measurements to detect contact with the neuron (6), form a gigaseal (7), and break in (8). 9, After successful break-in, a whole cell recording is performed. A fully automatic patching process is defined as the successful automatic execution of all steps from loading a new pipette to obtaining a whole cell patch (marked by dark green lines). If adjustments are to be made at any point to this automatic process, it is defined as a semiautomatic patching trial (marked by light green lines). Such adjustments are mainly manipulator mechanical error correction, caused by mechanical errors in manipulator positioning, and touch cell error correction, caused by incorrect cell contact detection. Dark green borders indicate fully automatic procedure; light green borders indicate a semiautomatic trial, involving at least some human interference. DIC, differential interference contrast. B: computer vision algorithm is used to determine the coordinates of the pipette tip during automatic calibration. A series of images along the optical z-axis are acquired under bright-field illumination to determine if the pipette tip is in focus using local contrast detection. Gaussian blur, Canny edge detection, and Hough transform are then applied to identify the pipette tip (indicated by red dot), and the tip coordinates are identified (xp, yp, zp; also see Fig. 4A). C: computer vision algorithm used to detect and log coordinates of fluorescent cells. A series of images are acquired under epifluorescence illumination along the optical z-axis of the microscope (left), with the step size and the depth defined by an experimenter. Each acquired image at depth zn is analyzed using a series of thresholds to detect cell contours. The centroids of the identified cell contours for each threshold are superimposed and clustered along the x and y dimensions. Final cell coordinates are computed as the average of the corresponding x, y, z cluster coordinates.

