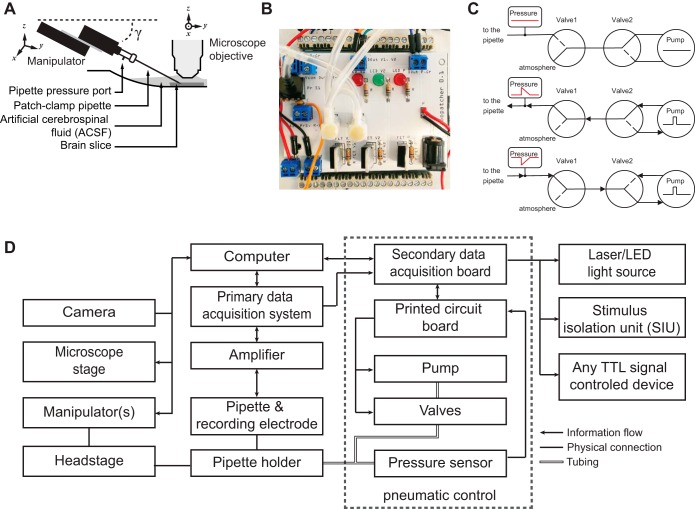
Fig. 2.
Experimental setup. A: standard patch-clamp electrophysiology equipment is used in conjunction with a pneumatic pressure control unit (also see Fig. 3) and our custom-written software. B: image of the pipette pneumatic pressure control unit prototype. Two solenoid valves (white circles, center) and an air pressure sensor (black square, top left) are connected to control the pipette internal pressure. The air pump is not shown. C: 3 different valve configurations resulting in no pressure (top) or brief pulses of positive (middle) or negative pressure (bottom) applied to the back end of the pipette when the pump is activated by a transistor-transistor logic (TTL) signal. The pressure sensor provides feedback information to control the minimum and maximum pressure during patching. D: block diagram of the hardware setup. A central computer controls all components of the Autopatcher IG. The primary data acquisition system provides an interface to the patch-clamp amplifier and allows the user to perform a standard electrophysiology experiment. The secondary data acquisition board provides an interface to the pressure control unit and to the external electronics hardware, which can communicate via TTL signals. On the sensor side are signals from the patch pipette, microscope camera, and internal pipette pressure sensor. The custom graphical user interface (GUI; see Fig. 3) allows the user to control the manipulator, camera setting, microscope stage, pressure control unit, and patch-clamp amplifier [via software development kits (SDK) for digital amplifiers (Axon MultiClamp 700B)].

