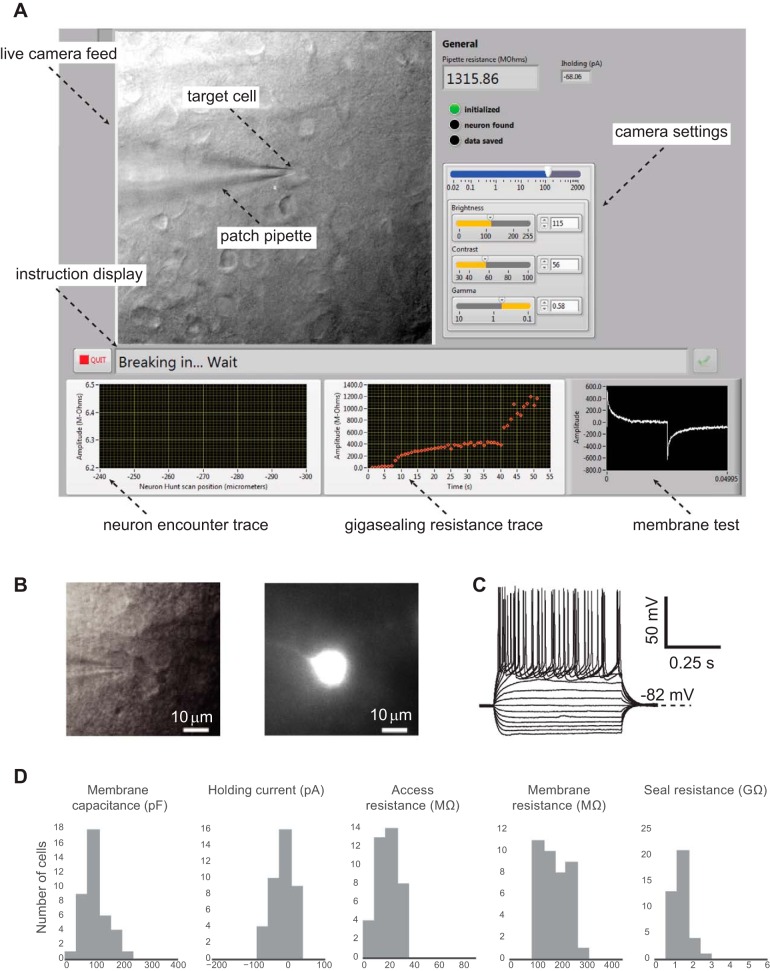
Fig. 4.
LabVIEW GUI, representative patch, and cell property statistics. A: LabVIEW-based GUI. B: a representative patched mouse neuron was filled with Alexa Fluor 594 and imaged at ×40 magnification. C: current-clamp recording of the same neuron in B shows response to a series of step current injections (−120 to +180 pA in 20-pA increments). D: measured properties of whole cell patches (n = 39 from 12 animals) are similar to properties determined by manual patching or automatic patching using a Python-based package.

