Fig. 7.
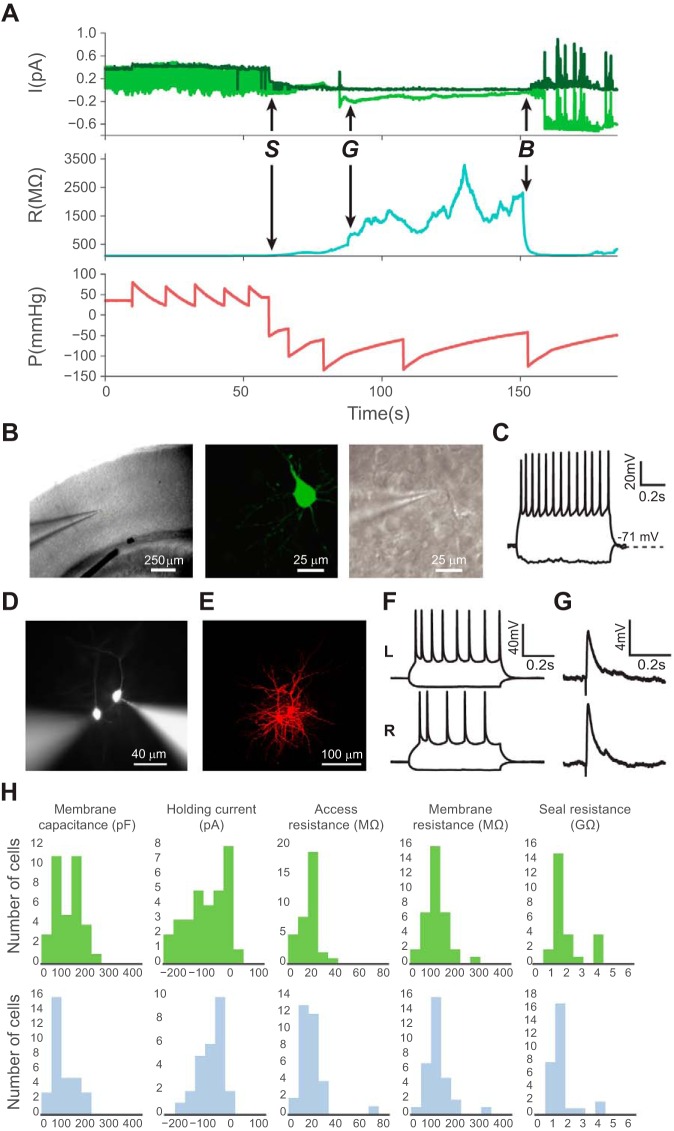
Automatic image-guided patch clamp yields high-quality whole cell recordings comparable with manual patching. A: example patch log of a successful patching trial with a history of current (I), resistance (R), and internal pipette pressure (P) parameters. Top, raw voltage input from the data acquisition board (light green) and the membrane test current (dark green). Middle, membrane resistance. Bottom, internal pipette pressure (letters denote key events in the patch-clamping process: S denotes the touch cell surface event, G denotes the time point at which a gigaseal is obtained, and B denotes when break-in is achieved). The “saw tooth” pressure pattern is caused by the on-off feedback pressure controller switching between pump-on and pump-off states. B: representative images show an automatically patched cell at ×4 magnification (left) and ×40 magnification DIC optics (middle) in a mouse visual cortex brain slice. Right, the same neuron filled with Lucifer yellow, postfixed, and visualized with ×40 magnification epifluorescence optics. C: electrophysiological responses of an automatically patch-clamped neuron to hyperpolarizing and depolarizing current injections. D: representative image of 2 simultaneously patched cells in a slice. E: confocal image of the 2 cells in D filled with Alexa 568 hydrazide and fixed after patching. F: electrophysiological responses of these 2 patched cells to hyperpolarizing and depolarizing current injections. Top, cell on the left (L); bottom, cell on the right (R). G: simultaneous recordings of excitatory postsynaptic potentials (EPSPs) from these neurons evoked by white matter stimulation. H: automatic patching (top; n = 30 from 3 mice) generates high-quality patches that are comparable to those obtained using conventional manual patching (bottom; n = 30 from 6 mice). There was no significant difference between the 2 groups in the distribution of membrane capacitance (P = 0.06), holding potential (P = 0.70), access resistance (P = 0.70), membrane resistance (P = 0.97), and seal resistance (P = 0.33, 2-tailed Student's t-test).

