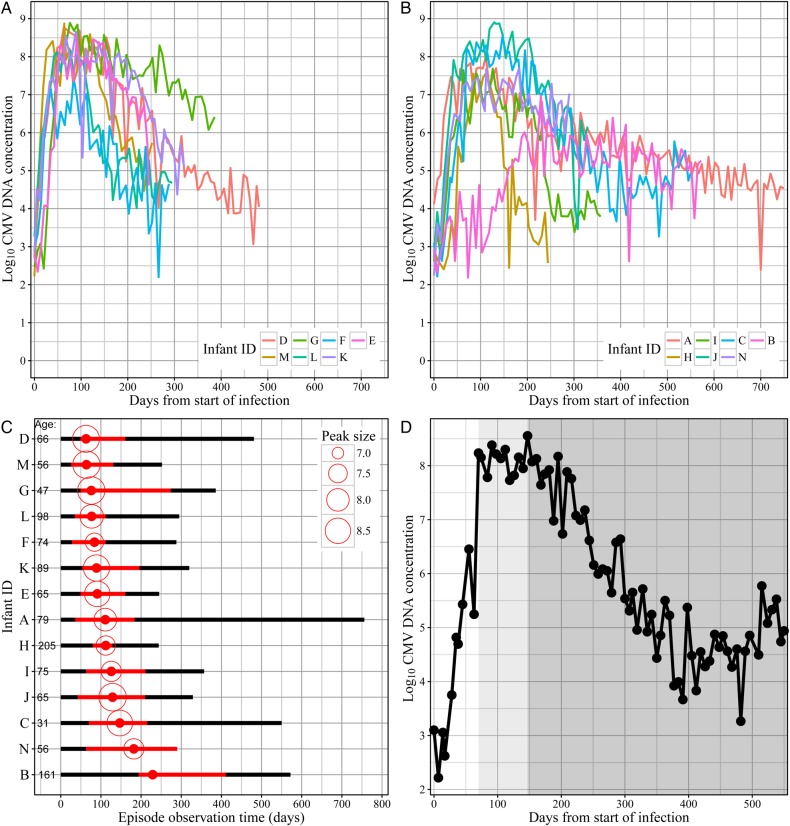
Figure 1.
Oral shedding of cytomegalovirus (CMV) during primary infection. A and B, Data for all infants are split into 2 groups for visual clarity (ordered by time of peak). Four CMV-negative swabs were removed from the plot. Lines correspond to oral concentrations of CMV DNA. C, Observation periods of primary episodes, ordered by time of peak. Initiations but not resolutions of CMV oral shedding episodes were observed. The time of peak is denoted by a solid red dot, and the size of the peak (log10 CMV DNA concentration) is denoted by size of the open circle. The red portion of the line corresponds to peak shedding levels within 1 log10 of the peak (which begins where the transition phase begins), and the black portion corresponds to lower shedding levels. Infant age at infection (days) is listed on the left side of the bars. D, Example of a primary CMV infection (which occurred in infant C). Three phases are evident: (1) an expansion phase (white shade), (2) a transition phase (shaded light gray), and (3) a clearance phase (shaded gray). This figure is available in black and white in print and in color online.

