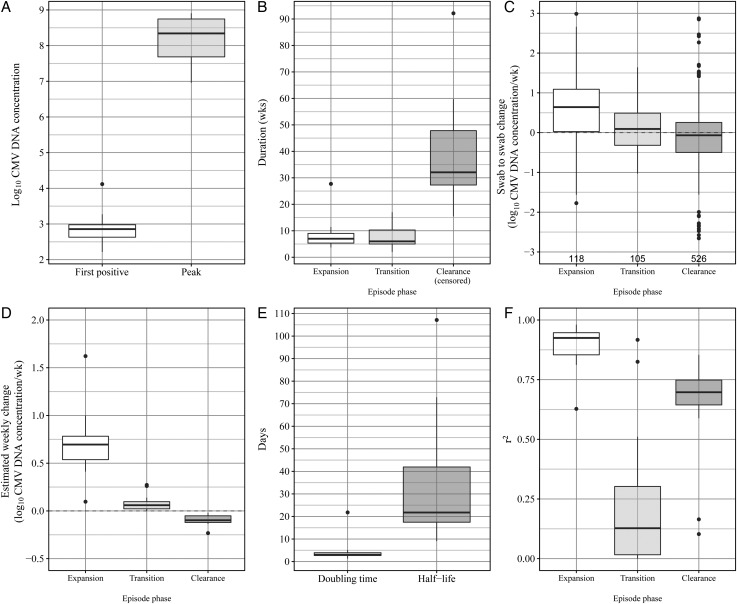
Figure 2.
Primary cytomegalovirus (CMV) episodes are characterized by slow expansion, transition, and clearance phases. Boxes represent the interquartile range (IQR) of the 14 episodes, the whiskers extend to cover all data within 1.5 IQR of the first or third quartile, and dots represent individual data points outside of this range. A, Quantity of CMV in the first CMV-positive swab and the CMV-positive swab obtained at peak CMV DNA load during primary infection. Difference indicates the growth of virus between episode initiation and peak. B, Duration (weeks) for each phase for each episode. C, Change in measured concentration between consecutive swabs for each swab for each phase. Sample size is displayed under the box. D, Estimated weekly change in CMV DNA concentration, based on a regression model for each phase for each episode. E, Estimated doubling time (expansion phase) and half-life (clearance phase) from regression results in panel D. F, r2 value from each regression in model shown in panel D.

