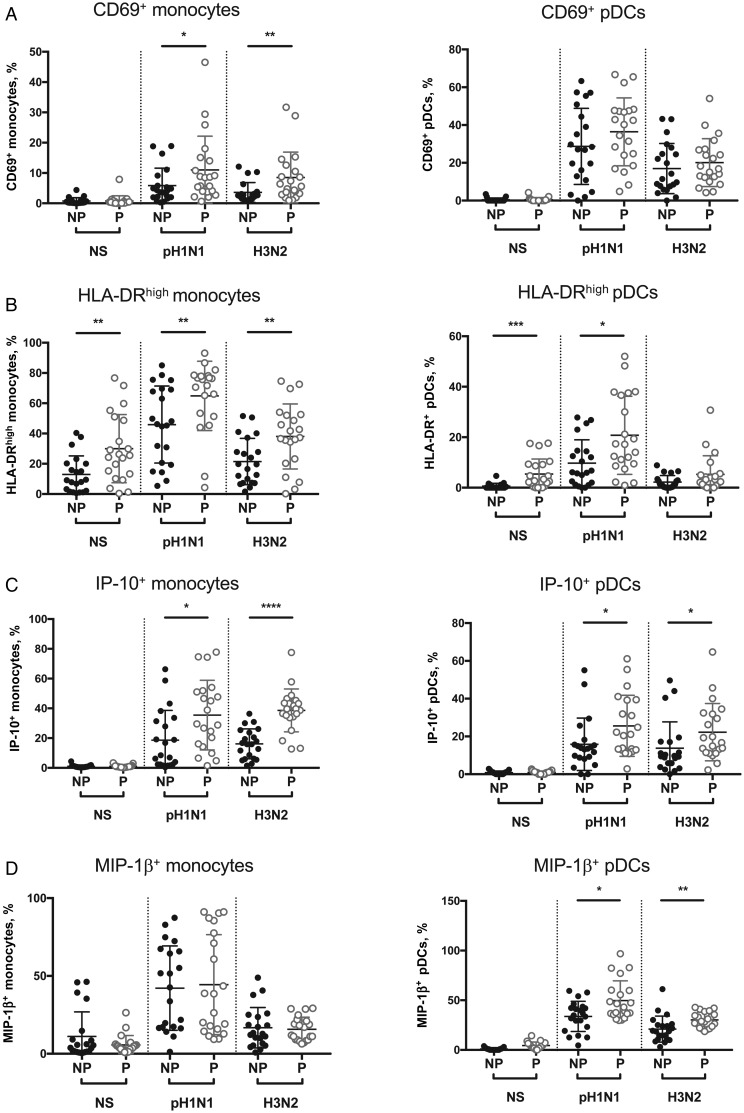
Figure 2.
Monocyte and plasmacytoid dendritic cell (pDC) immune responses to A/California/7/2009 (pH1N1) and A/Victoria/361/2011 (H3N2) influenza A virus infection in pregnant (P) and nonpregnant (NP) women. Peripheral blood mononuclear cells (PBMCs) from women in the NP (black dots) and P (gray dots) groups were infected with pH1N1 or H3N2 influenza A virus at a multiplicity of infection of 3 for 7 hours or were mock infected (NS). A, Frequency of CD69-expressing monocytes (left) and pDCs (right). B, Frequency of HLA-DR expression on monocytes and pDCs. C and D, Frequency of monocytes and pDCs producing interferon γ–induced protein 10 (IP-10) and macrophage inflammatory protein 1β (MIP-1β), respectively. Each dots represents the cell frequency for 1 patient. *P < .05, **P < .01, ***P < .001, and ****P < .0001 for differences between the P and NP groups.

