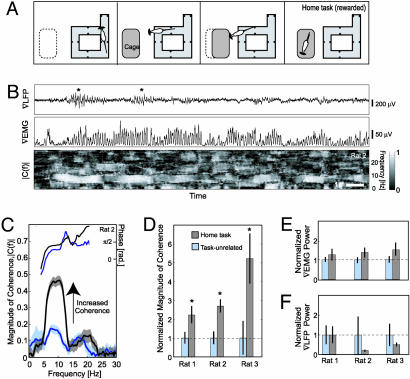
Fig. 5.
The response of the rat during the home task as compared with unrewarded whisking. (A) Diagram displaying the setup for the home task, wherein the cage is introduced at a fixed position, initially spaced 20 cm from the platform, and then moved to within contact distance 2–40 s later. (B) Representative trace in the home task. (Top) The ∇LFP. (Middle) The ∇EMG. (Bottom) The magnitude of the spectral coherence, |C(f)|, between the ∇LFP and the ∇EMG across the trial; C(f) was computed in a 1-s sliding window with a bandwidth of 2.5 Hz and a step size of 20 ms. (C) The magnitude and phase of the spectral coherence, C(f), for the home task versus unrewarded whisking for a single rat. The solid line is the mean, and the transparent band is ± 1 SDM. (D) Tabulation of the average magnitude of the spectral coherence of the response for the peak during the two categories of whisking. In all cases, the coherence during the home task is significantly higher (*, P < 0.02) than that in unrewarded whisking. For rat 3 only, the coherence during the home task was significantly greater than that during contact (P < 0.05; see also Fig. 3F). The bars are ± 2 SDM. (E and F) Tabulation of the relative power in the ∇EMG and ∇LFP, respectively, averaged in the 7- to 11-Hz whisking band, across all three rats (n = 22, 88, and 83 trials, respectively, for the home task and n = 111, 195, and 160 trials, respectively, for the unrewarded whisking).

