Abstract
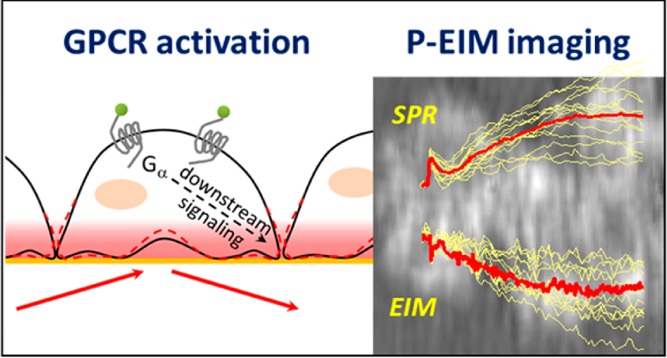
G protein-coupled receptors (GPCRs) are the largest protein family for cell signal transduction, and most of them are crucial drug targets. Conventional label-free assays lack the spatial information to address the heterogeneous response from single cells after GPCRs activation. Here, we reported a GPCRs study in live cells using plasmonic-based electrochemical impedance microscopy. This label-free optical imaging platform is able to resolve responses from individual cells with subcellular resolution. Using this platform, we studied the histamine mediated GPCRs activation and revealed spatiotemporal heterogeneity of cellular downstream responses. Triphasic responses were observed from individual HeLa cells upon histamine stimulation. A quick peak P1 in less than 10 s was attributed to the GPCRs triggered calcium release. An inverted P2 phase within 1 min was attributed to the alternations of cell–matrix adhesion after the activation of Protein Kinase C (PKC). The main peak (P3) around 3–6 min after the histamine treatment was due to dynamic mass redistribution and showed a dose-dependent response with a half-maximal effective concentration (EC50) of 3.9 ± 1.2 μM. Heterogeneous P3 responses among individual cells were observed, particularly at high histamine concentration, indicating diverse histamine H1 receptor expression level in the cell population.
The G protein-coupled receptors (GPCRs) belong to a superfamily of seven transmembrane-spanning proteins. They mediate cellular events in response to a diverse array of extracellular physical and chemical stimuli.1,2 GPCRs also control a wide variety of metabolic functions and participate in progressions of numerous diseases.3−5 Over a half of all marketed pharmaceuticals target GPCRs, which bring in billions of profits in US dollars.6−9 Therefore, a better understanding of GPCRs signaling events together with more sophisticated assays for identifying and characterizing new molecules targeting GPCRs remain the major focuses for the pharmaceutical industry.
Cell-based GPCRs screening with label-free technologies has received more attention in recent years. Most of these label-free assays detect the optical or impedance response originating from cellular morphological changes.10 A combination of these assays with fluorescence imaging and molecular biology techniques has also led to in-depth studies of GPCRs related physiological processes. Despite the wide use of label-free technologies in cell-based GPCRs screening, current approaches only measure the averaged response over a large population of the cells and provide little information on individual cell responses or subcellular activities. GPCRs often trigger multiple downstream signaling pathways and lead to heterogeneous responses among individual cells and/or subcellular areas. A spatiotemporally resolved measurement is greatly needed for a comprehensive understanding of the entire process.
Plasmonic-based electrochemical impedance microscopy (P-EIM) is a recently developed multifunctional label-free imaging platform that has been used to study chemical and electrochemical reactions,11,12 molecular binding kinetics,13,14 and various cellular processes.15,16 The detection principle of P-EIM is based on the sensitive dependence of the surface plasmon resonance (SPR) on the surface charge density of a gold sensing surface. The modulated SPR signal was measured in response to the applied alternating current, and the dc and ac components were converted to SPR and EIM (electrochemical impedance microscopy) images, respectively.14,15 The SPR image is sensitive to mass change near the sensing surface and therefore can measure the cellular mass distribution and dynamics, and the EIM image provides information on cellular impedance or electrochemical reactions. P-EIM is a powerful imaging tool for studying cellular processes with submicrometer spatial resolution and millisecond temporal resolution.15,16
Histamine H1 receptor is an important drug target in the GPCRs family. The binding between H1 receptor and its agonist histamine sequentially activates the receptors, triggers calcium signaling, activates the Protein Kinase C (PKC) process, and further leads to increased vascular permeability through changing cell adhesion. This change allows fluid and circulating cells from the blood to enter into the surrounding tissues and causes symptoms such as swelling, redness, and tenderness.17 In our previous report, we specifically focused on the calcium signaling of a single cell at the early stage of the GPCRs activation, which happened within the first 5 s after histamine stimulation.16 Here, we studied the GPCRs signaling in a broader time range, from tens of seconds to minutes, and observed heterogeneous triphasic responses to histamine triggered GPCR activation in a population of HeLa cells with subcellular resolution. Heterogeneous responses to GPCR activation among individual cells were revealed, particularly at high histamine concentration. The half-maximal effective concentration (EC50) was determined from dose-dependent SPR responses, and the alternations of cell–matrix adhesion were quantitatively studied with subcellular resolution.
Materials and Methods
Materials
NaCl, KCl, MgCl2·6H2O, CaCl2, N-(2-hydroxyethyl)piperazine-N′-(2-ethanesulfonic acid) (HEPES), d-glucose, 1,2-bis(2-aminophenoxy)ethane-N,N,N′,N′-tetraacetic acid (BAPTA-AM), cytochalasin D, triprolidine hydrochloride, and pyrilamine maleate salt were purchased from Sigma-Aldrich. Histamine dihydrochloride was purchased from Alfa Aesar. Deionized water was used to prepare all the buffers.
Cell Culture
The human HeLa cells were cultured in a humidified atmosphere at 37 °C with 5% CO2 and 70% relative humidity. Cells were grown in Dulbecco’s modified eagle’s medium (DMEM, BioWhittaker) with 10% fetal bovine serum (FBS, Invitrogen) with 100 units/mL penicillin and 100 μg/mL streptomycin (Invitrogen). Cells were passaged with 0.05% trypsin and 0.02% ethylenediamine-tetraacetic acid (EDTA) in Hank’s balanced salt solution (HBSS, Sigma-Aldrich) when a confluence of 75% was reached.
P-EIM Microscopy
The P-EIM setup was based on an objective-based inverted microscope system introduced by Zare and colleagues.18 The optical system was comprised of a fiber-coupled 680 nm superluminescent diode light source (Qphotonics, LLC), an inverted microscope (Olympus IX81), and a CCD camera (Pike F032B, Allied Vision). The typical frame rate was from 20 to 380 fps, depending on the requirements of the experiments. The sensor chips were BK7 glass coverslips coated with ∼2 nm of chromium followed by ∼47 nm of gold. Before use, each chip was washed with water and ethanol, followed by hydrogen flame-annealing to remove surface contamination. A Flexi-Perm silicon chamber (Sarstedt) was placed on top of the gold chip to serve as cell culture well and experimental sample holder.
The electrical potential of the sensor surface was controlled with respect to an Ag/AgCl reference electrode with a bipotentiostat (Pine ARFDE5) and a platinum-wire counter electrode. Modulation with typical frequency (45 or 160 Hz), amplitude (±200 mV), and offset (−200 mV) was applied using an external function generator (DS345, Stanford Research Systems).
HeLa cells were seeded on the gold sensor chips. After overnight incubation, the cells adhered to the gold surface and spread out. HeLa monolayers were loaded with extracellular fluid (ECF) buffer (NaCl: 120 mM; KCl: 3 mM; MgCl2: 2 mM; CaCl2: 2 mM; d-glucose: 25 mM; HEPES: 10 mM, pH 7.4) for the P-EIM measurements. Histamine dihydrochloride was dissolved in the ECF buffer with desired concentrations.
Results and Discussion
P-EIM Measured HeLa Cells Responses to Histamine Induced GPCR Activation
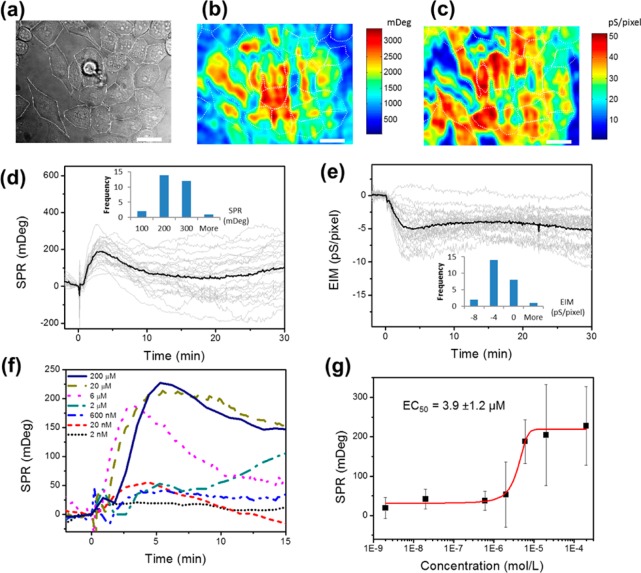
The typical bright field, SPR, and EIM images of HeLa cells are shown in Figure 1a–c. Six μM of histamine was introduced to HeLa cells to activate the endogenous histamine H1 receptor on the cells. The averaged SPR signal of the HeLa cell population (black line in Figure 1d) reached a peak value at around 4 min after exposure to histamine and then dropped slowly. The SPR responses from individual cells behaved differently (shown as gray lines in Figure 1d). The EIM images showed a similar but reverse trend of the responses (Figure 1e). The histograms of peak values of each cell at 4 min after the injection of histamine (insets in Figure 1d,e) further illustrated the heterogeneous responses among individual cells. The averaged SPR and EIM responses were consistent with the results measured by the commercial optical and electrochemical label-free systems.2,10,19 However, P-EIM provided individual cell information not available from any of these commercial technologies.
Figure 1.
Real time P-EIM recording of cell responses to histamine triggered GPCR activation. Bright field (a), SPR (b), and EIM (c) images of HeLa cells on the Au sensor chip. White dotted lines outline the cells. Scale bar: 20 μm. The size of a single pixel is ∼0.50 μm2. SPR (d) and EIM (e) recorded whole cell responses to endogenous GPCR activation stimulated by 6 μM histamine injected at t = 0 min. Gray profiles represent the responses of individual cells, and black profiles are the averages of all the cells. Insets: histograms of the SPR (or EIM) peak values of individual cells after histamine treatment when the averaged SPR (or EIM) response reached its peak at ∼4 min. (f) SPR profiles of GPCR stimulation by different histamine concentrations (2 nM to 200 μM). Each profile represents the averaged SPR response of the cells in the imaging field. (g) Dose–response plot generated by plotting the averaged peak SPR responses at 3–6 min after histamine treatment versus corresponding histamine concentrations. EC50 value was calculated from the dose response fitting curve (red curve). The error bars represent the standard deviation among individual cell responses.
After we applied the first dose of histamine and washed with buffer, HeLa cells showed an attenuated SPR response to the second application (Supporting Information S1), indicating the desensitization of histamine GPCR receptors.20 Therefore, all data reported below were P-EIM responses of HeLa cells to the first exposure of histamine, and fresh HeLa cell coated chips were used for each measurement. To test whether the response is dose dependent, we applied different concentrations (2 nM to 200 μM) of histamine to HeLa cells. Figure 1f shows the cellular responses with various concentrations. Each curve represented the averaged SPR response of all cells in the images. Dose-dependent responses were clearly observed. We further calculate the peak values from each curve and plot them against the logarithmic concentration of histamine (Figure 1g). Note that the error bars are the standard deviations of SPR peak values of individual cells in the field of view (e.g., Figure 1b,d), which represent the cell-to-cell variations in the cell populations. The large standard deviations at higher histamine concentrations indicate highly heterogeneous cellular responses to histamine stimulation among the measured cells, which likely reflect diverse histamine H1 receptor expression level in the cell population. The half-maximal effective concentration (EC50) is 3.9 ± 1.2 μM after fitting, which is within the range of published values.21,22 The histamine evoked SPR responses were also well inhibited by two specific antagonists, tripolindine and pyrilamine (Supporting Information S2), which confirms that the P-EIM responses are specific to histamine triggered GPCR activated cellular responses.
Triphasic and Heterogenic P-EIM Responses
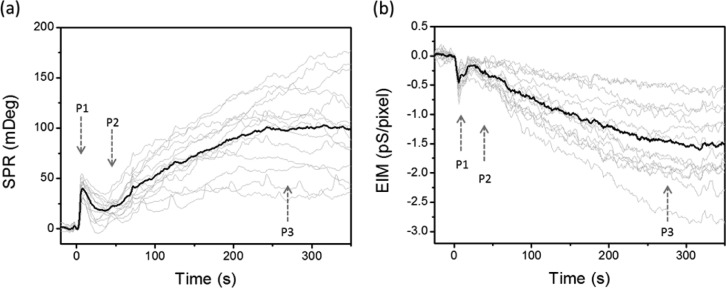
Besides the main broad peak around 5 min after drug application, a close look at the first 5 min of the response curves revealed two small peaks (P1 and P2) in both SPR (Figure 2a) and EIM (Figure 2b) profiles, before the main peak (P3). This characteristic triphasic response was observed from both the ensemble signal of multiple cells and signals from individual cells. The initial quick peak (P1) is typically evoked in less than 10 s. This peak corresponds to the calcium release after GPCR activation as we reported previously.16
Figure 2.
Triphasic and heterogenic P-EIM responses. SPR (a) and EIM (b) profiles of GPCR stimulation by 18 μM histamine in the first 350 s. Arrows indicate three phases (P1, P2, P3) of the profiles. Gray profiles represent the responses of individual cells, and black profiles are the averages of all the cells in the imaging field. The size of a single pixel is ∼0.97 μm2.
Similar to P3, heterogeneous peak amplitudes among individual cells were also observed for both P1 and P2. In addition, a quantitative analysis of the P1 and P2 peaks (Figure S3) revealed unsynchronized peak positions for each cell. As listed in Table S1, SPR measured P1 ranged from 4 to 11 s and P2 ranged from 21 to 52 s, while EIM measured P1 ranged from 2 to 5 s and P2 ranged from 13 to 30 s. These results show that P-EIM is able to measure the temporal and spatial heterogeneity of GPCR activated cellular responses among individual cells.
The averaged time points of P1 and P2 peaks measured by EIM (2.9 and 22.4 s) were ahead of the peaks measured by SPR (6.4 and 35.4 s). While SPR measures mass changes in the bottom part of cells, EIM detects the charge involved impedance changes from the entire cells.15,16 Therefore, the faster responses of EIM signal than SPR signal imply that (1) the GPCR activated cellular process propagates from the top (or inside) of the cells to the bottom of the cells, and/or (2) charge involved cellular dynamics (such as calcium flow and kinase phosphorylation) are ahead of noncharge involved dynamics, such as mass redistribution.
Contributions of the Central Area of the Cells Revealing the P2 Peak by Subcelluar Analysis
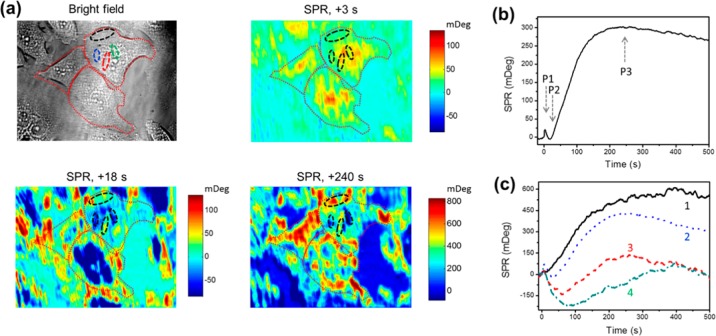
To analyze subcellular details of GPCR activation, we selected three cells (Figure 3a, bright field) and showed the snapshots of the SPR images at 3, 18, and 240 s (Figure 3a), which correspond to the P1, P2, and P3 phases (Figure 3b) of histamine activated GPCR responses. After the quick positive peak P1, the SPR signal of the cell center region then decreased, while other regions, especially the cell edge, remained stable at t = 18 s, resulting in the negative SPR peak (P2). After that, the center region recovered to the basal level and the edge region kept increasing until it reached the main peak (P3) after 200 s.
Figure 3.
P-EIM visualization of subcellular responses to GPCR activation. (a) The bright field image shows the HeLa cell locations, while differential SPR images show the spatial-temporal patterns of subcellular responses to GPCR activation, at t = 3, 18, and 240 s after histamine treatment. Red dotted lines outline the cells in the bright field and SPR images. (b) A typical whole cell SPR response profile to 6 μM histamine triggered GPCR activation in HeLa cells. Arrows P1 to P3 indicate times corresponding to SPR images shown in (a). (c) SPR response profiles of four different subcellular regions within a single cell that are marked by dotted lines with the corresponding colors in the bright field image and by dashed lines with black colors in SPR images in (a).
To quantify the subcellular response heterogeneity, we selected four subcellular regions within a cell (Figure 3a, outlined by dashed lines) and plotted the corresponding SPR profiles in Figure 3c. The region close to the cell edge has a less negative P2 phase and a larger P3 plateau value, while other regions located in the center of the cell have more negative P2 phases and lower P3 plateau levels. The profiles also reveal that larger negative P2 phases took a longer time to reach the P2 peak value.
Negative P2 Phase Measures Cell–Matrix Adhesion
It has been well established that the binding of histamine to native H1 receptors on the HeLa cell membrane23 mediates the release of Ca2+ from endoplasmic reticulum and consequently activates the Protein Kinase C (PKC) pathway. The formation of the Ca2+–calmodulin complex increases myosin light chain phosphorylation and initiates the contraction of actin filaments.24 Ca2+ also affects cadherin adhesion,25−27 causing altered cell adhesion junctions. Eventually, histamine regulates vascular endothelial permeability or airway epithelial permeability by altering the cell–cell and cell–matrix adhesion, resulting in an inflammatory response.
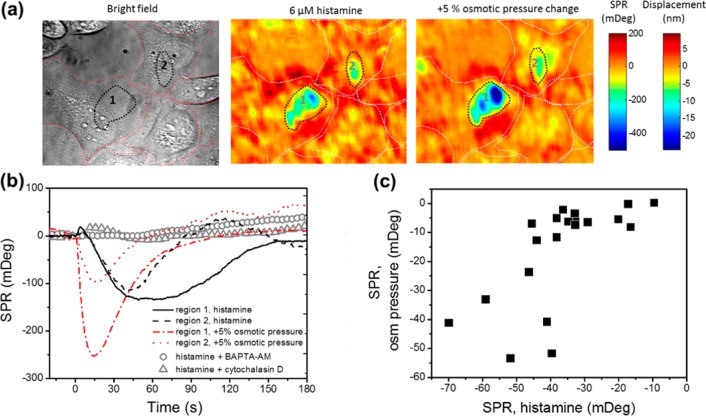
We found both P2 and P3 phases were inhibited by either BAPTA-AM or cytochalasin D pretreatment, which can chelate intercellular calcium or disrupt the process of actin polymerization, respectively (Figure 4b, open gray circle and triangle). It suggests that P2 and P3 phases correspond to the alteration of cell adhesion and cellular morphological changes caused by the PKC pathway triggered actin or cadherin activities. The main peak P3 has been reported to be caused by cellular morphological changes and dynamic mass redistribution.2,10,19
Figure 4.
P-EIM images revealed similarity between the P2 phase cellular responses to histamine activation and cellular responses to hypertonic stress. (a) The bright field image shows individual HeLa cells where red dotted lines outline the cells. Differential SPR images show cellular responses to 6 μM histamine stimulation and +5% osmotic pressure change, when the SPR response reaches its lowest value (55 s after histamine injection and 19 s after osmotic pressure change). White dotted lines outline the cells in the SPR images. (b) The SPR responses to histamine stimulation (region 1: black solid line; region 2: black dashed line) and +5% osmotic pressure change (region 1: red dash-dotted line; region 2: red dotted line) at the two black dotted lines marked subcellular regions in the images. The averaged SPR responses of histamine stimulation after 10 μM BAPTA-AM pretreatment for 20 min (open gray circle, ○) and 100 nM cytochalasin D pretreatment for 30 min (open gray triangle, Δ) of multiple cells are shown as controls. (c) Correlation map of lowest SPR values after histamine stimulation (P2 phase) versus +5% osmotic pressure change as shown in (b) from 20 different cells.
We further compared the SPR images of the negative P2 phase after histamine activation with the cellular response to the hypertonic stress. These two distinct cellular events showed almost the same subcellular SPR response patterns (Figure 4a) and intensities (Figure 4b). The multiple-cell analysis (N = 20) also showed that the negative SPR responses of histamine activation were proportional to the hypertonic treatment (Figure 4c). It is known that hypertonic buffers increase extracellular osmotic pressure and cause the cell to shrink and to detach from the substrate,28 which in turn decreases the local SPR intensity. Therefore, it suggests that the observed negative P2 phase of SPR also corresponds to the cell–matrix adhesion alteration caused by histamine activation. Both cellular events affect the same subcellular regions where cell–matrix interactions are weak and easily disturbed.
The cell–matrix adhesion alternation induced by histamine has been previously studied by fluorescence, transmission electron microscopy, scanning electron microscopy, and impedance spectroscopy.25−27,29 However, the microscopy-based methods lack the needed temporal resolution and quantitative information to measure real time cellular dynamics, and the spectroscopy method lacks the needed spatial resolution to resolve individual cell and subcellular responses. P-EIM provides both subcellular spatial resolution and fast temporal response, which allows real time quantitative mapping of the cell–matrix displacement within a single cell. By simulating the SPR response to the cellular structure using the Winspall program (http://www.res-tec.de/downloads.html), the average cell–matrix distance is estimated to be 103 nm, with a sensitivity of 0.048 nm/mDeg for cell–matrix displacement (Supporting Information S4). Therefore, on the basis of the local SPR intensity change, we calculated the cell–matrix displacement with values typically around a few to ten nanometers (Figure 4a, indicated as the displacement color map).
A pixel-wised quantitative analysis of the cell images in Figure 3 enabled one to visualize the spatiotemporal heterogeneity of histamine induced cell–matrix interaction alternations at the P2 peak. The original SPR image sequences were processed by 4 × 4 binning to reduce shot noises, and then, the peak values for each pixel in the image sequences were converted to the cell–matrix displacement distances; the corresponding peak positions were identified as the response time. The results are shown as maps of maximum cell–matrix distance displacements (Figure 5a) and the response time (Figure 5b). The positions of the cold pixels (blue color) in Figure 5a matched well with the hot pixels (bright yellow color) in Figure 5b, indicating the response time is scaled with cell–matrix distance displacements.
Figure 5.
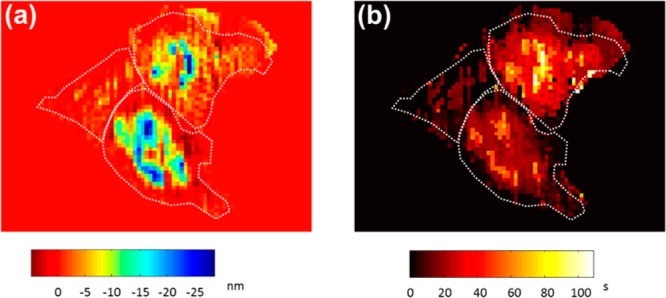
The spatiotemporal heterogeneity of histamine induced cell–matrix interaction alternations. Mapping of (a) the maximum cell–matrix distance displacements and (b) the corresponding response time at the lowest points of the negative P2 phase after histamine activation. White dotted lines outline the cells, and the values outside the cells were set to zero.
Conclusion
P-EIM was used to monitor real time cellular dynamics of histamine evoked GPCRs activation in HeLa cells. Triphasic responses from individual cells were observed in both SPR and EIM images. The initial quick peak (P1) in less than 10 s was attributed to the GPCR triggered calcium release. The inverted P2 phase within 1 min is believed to be due to the alternations of cell–matrix adhesion activated by the PKC pathway, because the subcellular analysis shows that the P2 phase is similar to the cellular response to the hypertonic stress. The dynamic mass redistribution contributed to the main peak (P3) around 3–6 min after the histamine treatment, and it showed a dose-dependent response with EC50 = 3.9 ± 1.2 μM, consistent with reported values. Highly scattered P3 responses among individual cells indicated diverse histamine H1 receptor expression levels in the cell population. We further quantified the cell–matrix vertical displacements with nanometer precision and visualized the cell–matrix interaction dynamics using single-pixel-based analysis. Our findings show that P-EIM is a useful tool to study the GPCR activation process and for understanding the subcellular basis of histamine triggered cellular permeability regulation, which will help the development of novel inflammation therapeutics and antihistamine drugs.
Acknowledgments
We acknowledge financial support from National Institute of Health (8R21GM103396, 5R01GM107165), National Science Foundation (#1151105), and National Natural Science Foundation of China (No. 21621003, No. 21235004, No. 21327806).
Supporting Information Available
The Supporting Information is available free of charge on the ACS Publications website at DOI: 10.1021/acs.analchem.6b02677.
Histamine desensitization, antagonist treatments, unsynchronized peak positions of triphasic P-EIM response, and cell–matrix distance simulation (PDF)
The authors declare no competing financial interest.
Supplementary Material
References
- Hamm H. E. Proc. Natl. Acad. Sci. U. S. A. 2001, 98, 4819–4821. 10.1073/pnas.011099798. [DOI] [PMC free article] [PubMed] [Google Scholar]
- Fang Y.; Frutos A. G.; Verklereen R. Comb. Chem. High Throughput Screening 2008, 11, 357–369. 10.2174/138620708784534789. [DOI] [PubMed] [Google Scholar]
- Rockman H. A.; Koch W. J.; Lefkowitz R. J. Nature 2002, 415, 206–212. 10.1038/415206a. [DOI] [PubMed] [Google Scholar]
- Neubig R. R.; Siderovski D. P. Nat. Rev. Drug Discovery 2002, 1, 187–197. 10.1038/nrd747. [DOI] [PubMed] [Google Scholar]
- Pierce K. L.; Premont R. T.; Lefkowitz R. J. Nat. Rev. Mol. Cell Biol. 2002, 3, 639–650. 10.1038/nrm908. [DOI] [PubMed] [Google Scholar]
- Hopkins A. L.; Groom C. R. Nat. Rev. Drug Discovery 2002, 1, 727–730. 10.1038/nrd892. [DOI] [PubMed] [Google Scholar]
- Overington J. P.; Al-Lazikani B.; Hopkins A. L. Nat. Rev. Drug Discovery 2006, 5, 993–996. 10.1038/nrd2199. [DOI] [PubMed] [Google Scholar]
- Zambrowicz B. P.; Sands A. T. Nat. Rev. Drug Discovery 2003, 2, 38–51. 10.1038/nrd987. [DOI] [PubMed] [Google Scholar]
- Howard A. D.; McAllister G.; Feighner S. D.; Liu Q.; Nargund R. P.; Van der Ploeg L. H.; Patchett A. A. Trends Pharmacol. Sci. 2001, 22, 132–140. 10.1016/S0165-6147(00)01636-9. [DOI] [PubMed] [Google Scholar]
- Scott C. W.; Peters M. F. Drug Discovery Today 2010, 15, 704–716. 10.1016/j.drudis.2010.06.008. [DOI] [PubMed] [Google Scholar]
- Shan X.; Chen S.; Wang H.; Chen Z.; Guan Y.; Wang Y.; Wang S.; Chen H. Y.; Tao N. Adv. Mater. 2015, 27, 6213–6219. 10.1002/adma.201502822. [DOI] [PubMed] [Google Scholar]
- Shan X.; Patel U.; Wang S.; Iglesias R.; Tao N. Science 2010, 327, 1363–1366. 10.1126/science.1186476. [DOI] [PubMed] [Google Scholar]
- Liang W.; Wang S.; Festa F.; Wiktor P.; Wang W.; Magee M.; LaBaer J.; Tao N. Anal. Chem. 2014, 86, 9860–9865. 10.1021/ac5024556. [DOI] [PMC free article] [PubMed] [Google Scholar]
- Lu J.; Wang W.; Wang S.; Shan X.; Li J.; Tao N. Anal. Chem. 2012, 84, 327–333. 10.1021/ac202634h. [DOI] [PMC free article] [PubMed] [Google Scholar]
- Wang W.; Foley K.; Shan X.; Wang S.; Eaton S.; Nagaraj V. J.; Wiktor P.; Patel U.; Tao N. Nat. Chem. 2011, 3, 249–255. 10.1038/nchem.961. [DOI] [PMC free article] [PubMed] [Google Scholar]
- Lu J.; Li J. Angew. Chem., Int. Ed. 2015, 54, 13576–13580. 10.1002/anie.201505991. [DOI] [PubMed] [Google Scholar]
- Thurmond R. L.; Gelfand E. W.; Dunford P. J. Nat. Rev. Drug Discovery 2008, 7, 41–53. 10.1038/nrd2465. [DOI] [PubMed] [Google Scholar]
- Huang B.; Yu F.; Zare R. N. Anal. Chem. 2007, 79, 2979–2983. 10.1021/ac062284x. [DOI] [PubMed] [Google Scholar]
- Yu N.; Atienza J. M.; Bernard J.; Blanc S.; Zhu J.; Wang X.; Xu X.; Abassi Y. A. Anal. Chem. 2006, 78, 35–43. 10.1021/ac051695v. [DOI] [PubMed] [Google Scholar]
- Pitcher J. A.; Freedman N. J.; Lefkowitz R. J. Annu. Rev. Biochem. 1998, 67, 653–692. 10.1146/annurev.biochem.67.1.653. [DOI] [PubMed] [Google Scholar]
- Bristow D. R.; Arias-Montano J. A.; Young J. M. Br. J. Pharmacol. 1991, 104, 677–684. 10.1111/j.1476-5381.1991.tb12488.x. [DOI] [PMC free article] [PubMed] [Google Scholar]
- Bristow D. R.; Zamani M. R. Br. J. Pharmacol. 1993, 109, 353–359. 10.1111/j.1476-5381.1993.tb13577.x. [DOI] [PMC free article] [PubMed] [Google Scholar]
- Tilly B. C.; Tertoolen L. G.; Lambrechts A. C.; Remorie R.; de Laat S. W.; Moolenaar W. H. Biochem. J. 1990, 266, 235–243. 10.1042/bj2660235. [DOI] [PMC free article] [PubMed] [Google Scholar]
- Pober J. S.; Sessa W. C. Nat. Rev. Immunol. 2007, 7, 803–815. 10.1038/nri2171. [DOI] [PubMed] [Google Scholar]
- Guo M.; Breslin J. W.; Wu M. H.; Gottardi C. J.; Yuan S. Y. Am. J. Physiol. Cell Physiol. 2008, 294, C977–984. 10.1152/ajpcell.90607.2007. [DOI] [PMC free article] [PubMed] [Google Scholar]
- Zabner J.; Winter M.; Excoffon K. J.; Stoltz D.; Ries D.; Shasby S.; Shasby M. J. Appl. Physiol. 2003, 95, 394–401. 10.1152/japplphysiol.01134.2002. [DOI] [PubMed] [Google Scholar]
- Tiruppathi C.; Minshall R. D.; Paria B. C.; Vogel S. M.; Malik A. B. Vasc. Pharmacol. 2002, 39, 173–185. 10.1016/S1537-1891(03)00007-7. [DOI] [PubMed] [Google Scholar]
- Wang W.; Wang S.; Liu Q.; Wu J.; Tao N. Langmuir 2012, 28, 13373–13379. 10.1021/la301712h. [DOI] [PMC free article] [PubMed] [Google Scholar]
- Moy A. B.; Winter M.; Kamath A.; Blackwell K.; Reyes G.; Giaever I.; Keese C.; Shasby D. M. Am. J. Physiol. Lung Cell. Mol. Physiol. 2000, 278, L888–L898. [DOI] [PubMed] [Google Scholar]
Associated Data
This section collects any data citations, data availability statements, or supplementary materials included in this article.


