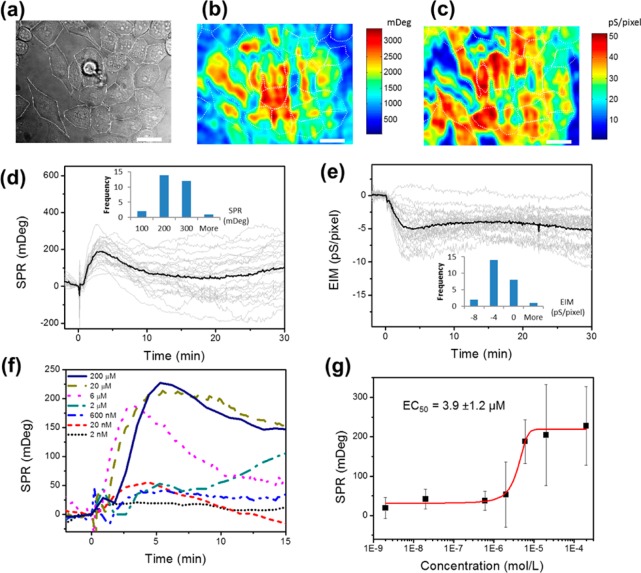
Figure 1.
Real time P-EIM recording of cell responses to histamine triggered GPCR activation. Bright field (a), SPR (b), and EIM (c) images of HeLa cells on the Au sensor chip. White dotted lines outline the cells. Scale bar: 20 μm. The size of a single pixel is ∼0.50 μm2. SPR (d) and EIM (e) recorded whole cell responses to endogenous GPCR activation stimulated by 6 μM histamine injected at t = 0 min. Gray profiles represent the responses of individual cells, and black profiles are the averages of all the cells. Insets: histograms of the SPR (or EIM) peak values of individual cells after histamine treatment when the averaged SPR (or EIM) response reached its peak at ∼4 min. (f) SPR profiles of GPCR stimulation by different histamine concentrations (2 nM to 200 μM). Each profile represents the averaged SPR response of the cells in the imaging field. (g) Dose–response plot generated by plotting the averaged peak SPR responses at 3–6 min after histamine treatment versus corresponding histamine concentrations. EC50 value was calculated from the dose response fitting curve (red curve). The error bars represent the standard deviation among individual cell responses.

