
Figure 5.
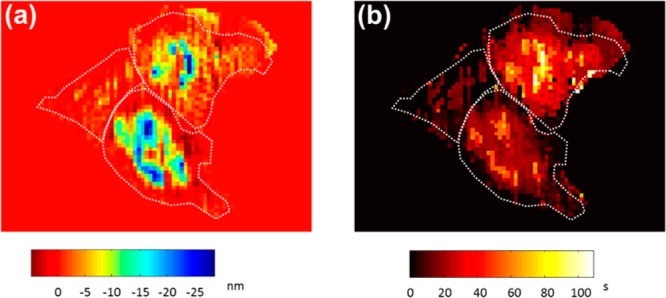
The spatiotemporal heterogeneity of histamine induced cell–matrix interaction alternations. Mapping of (a) the maximum cell–matrix distance displacements and (b) the corresponding response time at the lowest points of the negative P2 phase after histamine activation. White dotted lines outline the cells, and the values outside the cells were set to zero.