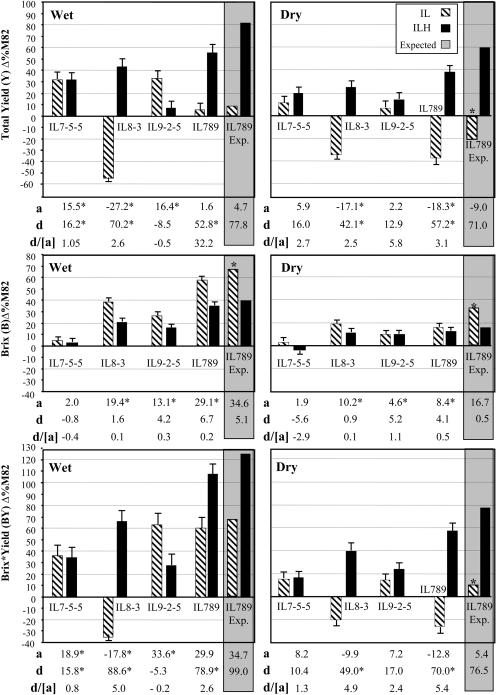
Figure 2. Pyramiding of S. pennellii Introgressions That Increase Agricultural Yield Components.
Introgression lines IL7-5-5, IL8-3, IL9-2-5, and IL789, which combines all three segments, were compared to M82 (percent difference from M82) in a homozygous (IL) and heterozygous (ILH) condition in wet and dry fields (1 plant/m2). The bars represent total yield (Y), brix (B), and brix × yield (BY) means (± standard error) from three growing seasons; these data were pooled, since no season × genotype interactions were found. The base line represents M82, where the mean BY values of M82 from the three seasons were 353 g/m2 in the irrigated treatment (455 g/m2 in 2001, 285 g/m2 in 2002, and 320 g/m2 in 2003) and 184 g/m2 in the dry treatment (244 g/m2 in 2001, 186 g/m2 in 2002, and 122 g/m2 in 2003). The additive effect (a) is half of the difference between each IL and M82. The dominance deviation (d) is the difference between ILH and the mid-value of its parents. Values marked by an asterisk are significant (p < 0.05). The bars in the gray background and their corresponding a and d values represent the expected values of IL789 and ILH789 assuming complete additivity of the introgression effects. Asterisks above the expected-value bars represent significant deviations from the observed means for IL789 or ILH789 as determined by a t test at a confidence level of 95%. All experiments were transplanted in a randomized block design with the following number of replications for each genotype under each irrigation regime: 2001, 10 replications; 2002, 15 replications; 2003, 15 replications.

