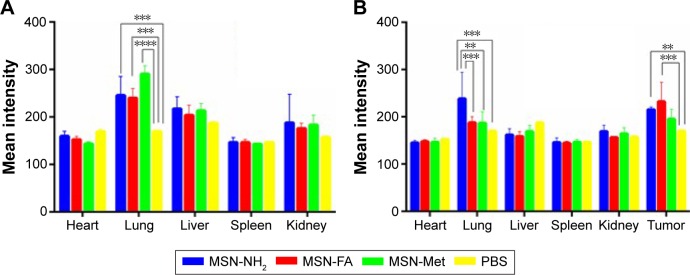
Figure 12.
Biodistribution of MSN-NH2, MSN-FA, and MSN-Met in (A) healthy and (B) tumor-induced BALB/c mice 2 hours following injection.
Notes: Obtained data were calculated as percentages of mean intensity and represented as mean ± SD (n=3). **P<0.05; ***P<0.01; ****P<0.001.
Abbreviations: MSN, mesoporous silica nanoparticle; FA, folic acid; Met, methionine; PBS, phosphate-buffered saline; SD, standard deviation.

