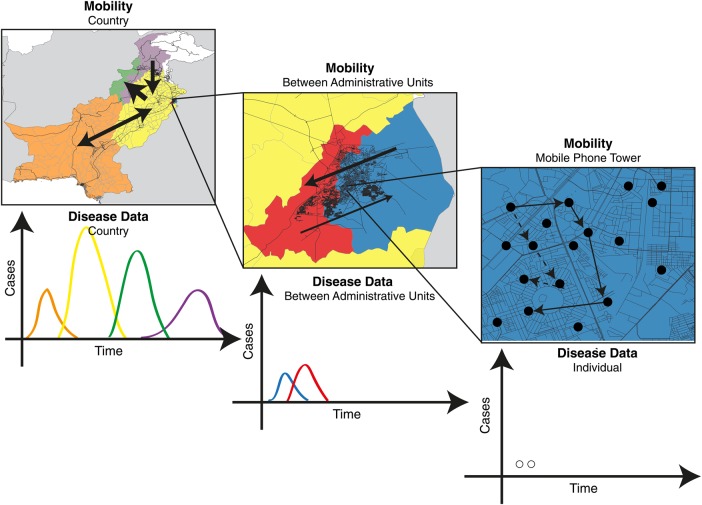
Figure 1.
A schematic describing the spatial scales of mobility measured using mobile phone calling data (map, above) and indicating what associated infectious disease data might look like (time course, below). Using mobile phone CDRs, an individual subscriber's location can be geolocated on the tower level (far right); however, this may be difficult to use in conjunction with the locations and timings of individual cases, given highly sporadic incidence. These mobility and infectious disease data can be aggregated to larger spatial areas, such as those between administrative units (middle panel), where patterns of incidence may resolve into clearer outbreaks, as, for example, when lags between outbreaks might map onto the flow of many individuals between larger spatial units.

