
Fig. 4.
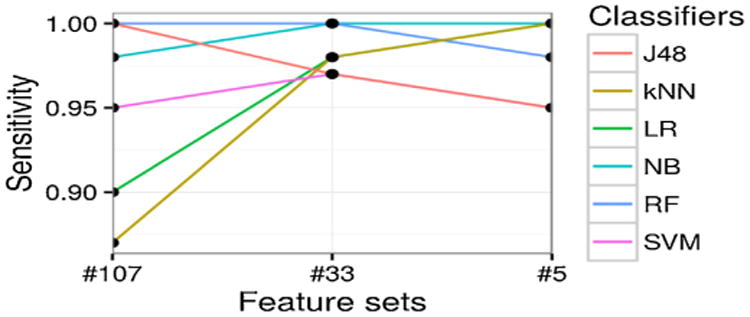
Prediction sensitivity [True positive rate] (y-axis) with different feature sets (x-axis), categorized by different classifiers (different lines plotted).
Official websites use .gov
A
.gov website belongs to an official
government organization in the United States.
Secure .gov websites use HTTPS
A lock (
) or https:// means you've safely
connected to the .gov website. Share sensitive
information only on official, secure websites.
Prediction sensitivity [True positive rate] (y-axis) with different feature sets (x-axis), categorized by different classifiers (different lines plotted).