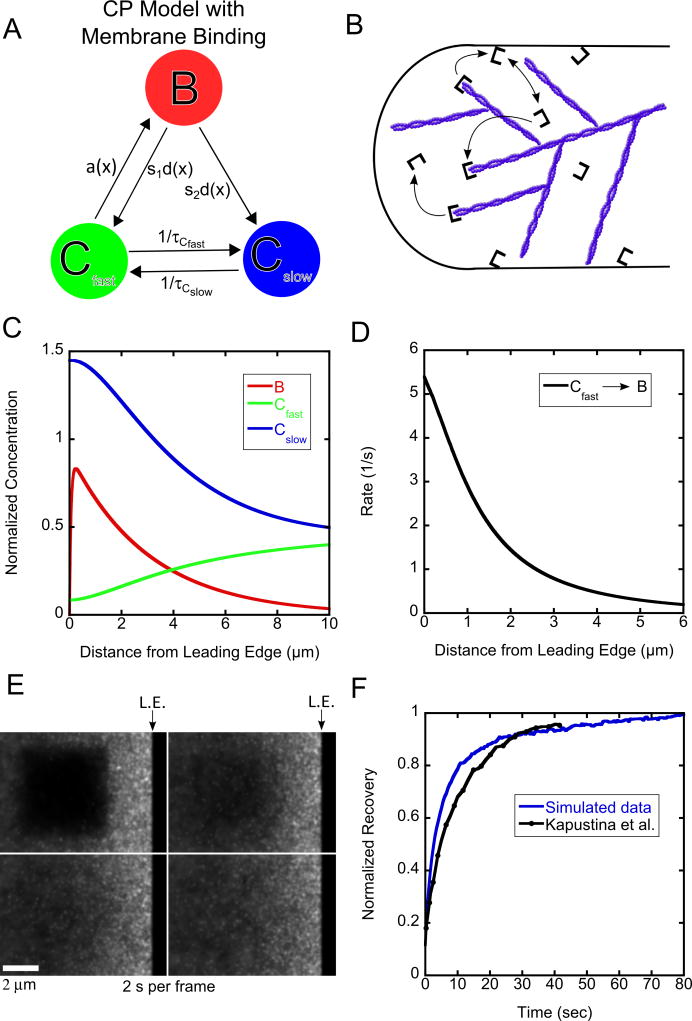
Figure 4.
Results of model with membrane binding for capping protein. (A, B). Schematic and cartoon of model with membrane binding. (C). Steady state concentration profiles for capping protein (D) Binding rates as function of distance. (E) Snapshot images of simulated FRAP. (F). FRAP curves compared to experimental data from Kapustina et al. [18]. The ending time of the experimental measurement (40 s) is normalized to the value of the simulation at 40 s. The simulated recovery is normalized to one at long times. Simulations in panels C–F use K = 0.45 s−1, DCfast = 2.0 μm2/s, DCslow = 0.5 μm2/s, vr = 0.03 μm/s, τ= 2.0 s, τCfast = 5.0 s, τCslow = 5.0 s, s1 = 0.1.

