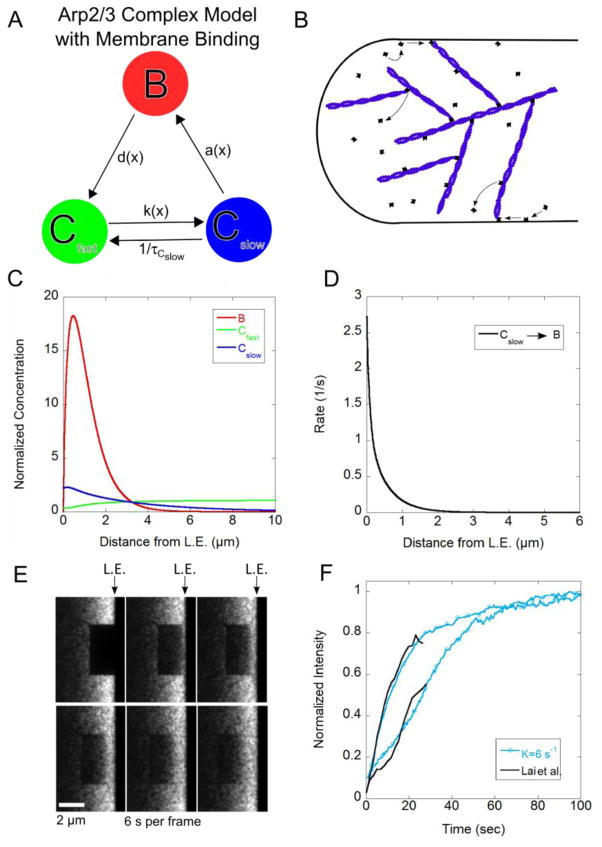
Figure 6.
Results of model with membrane binding for Arp2/3 complex. (A, B) Schematic and cartoon of model with Arp2/3 complex membrane binding. (C) Steady state concentration profile for Arp2/3 complex. (D) Binding rates as function of distance. (E) Snapshot images of simulated FRAP. (F) FRAP curves compared to experimental data from Lai et al. [24]. The simulated recovery is normalized to one at long times. Simulations in panels C–F use DCfast = 3 μm2/s, K = 6.0 s−1, τCslow = 20 s, vr = 0.04 μm/s, λm = 0.2 μm and km = 40 s−1.

