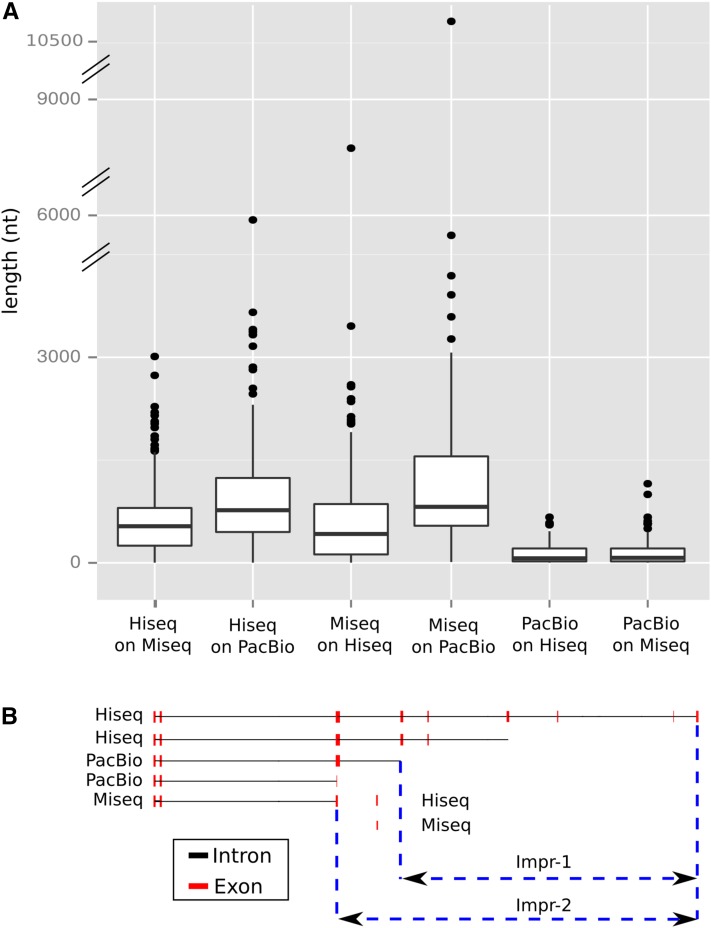
Figure 5.
(A) Contribution of each technology to improve the coverage of the single mapping units (SMU) when it performed best. (B) Example of splicing variants identified and mapped on the same SMU (P. lambertiana transcript annotated as “embryo defective 2410 isoform protein” via enTap) for each technology. In this example, HiSeq performed as the best technology providing the longest splicing variant. Longest splicing variant of the other two technologies was selected to calculate coverage improvement (as the sum of exon sequence lengths, blue dashed lines, Impr-1 = PacBio, Impr-2 = MiSeq) of HiSeq technology over them [lanes 1 and 2 from (A)].

