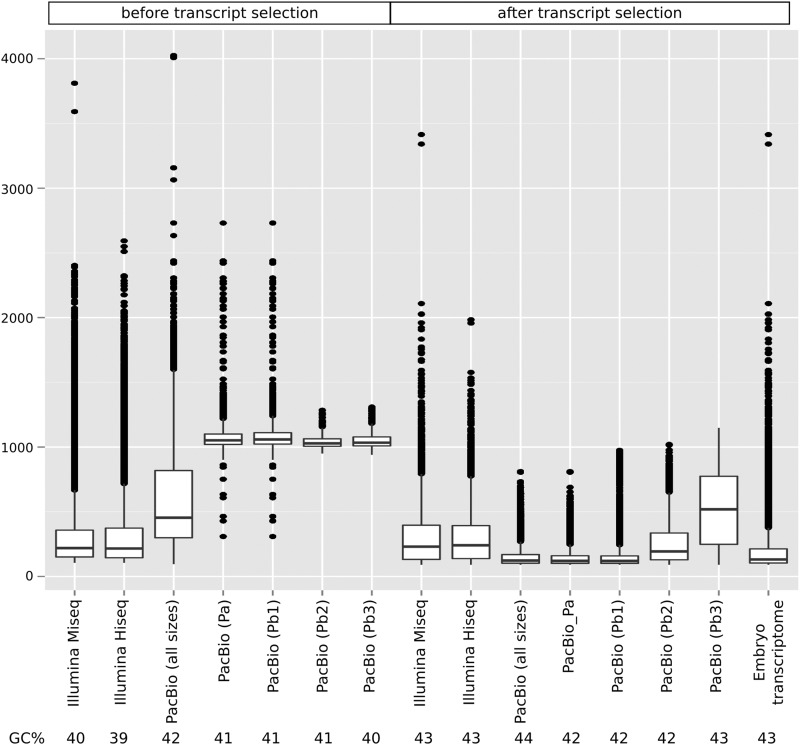
Figure 2.
Transcript length distribution resulting from different assemblies of the embryo samples across the three technologies (HiSeq, MiSeq, and PacBio). Length of transcripts was used to build a box-plot distribution before and after transcript selection (CDS identification + clustering). PacBio results are provided for transcripts identified as full-length (Pa), and set of transcripts after ICE/Quiver for isoform level clustering: consensus sequences (Pb1), low quality polished sequences (Pb2), and high quality polished sequences (Pb3). Embryo transcriptome: combination of independent assemblies of Illumina and PacBio data and transcript selection (CDS identification + clustering). Average GC content of transcripts is shown in the bottom of the figure.

