Figure 3.
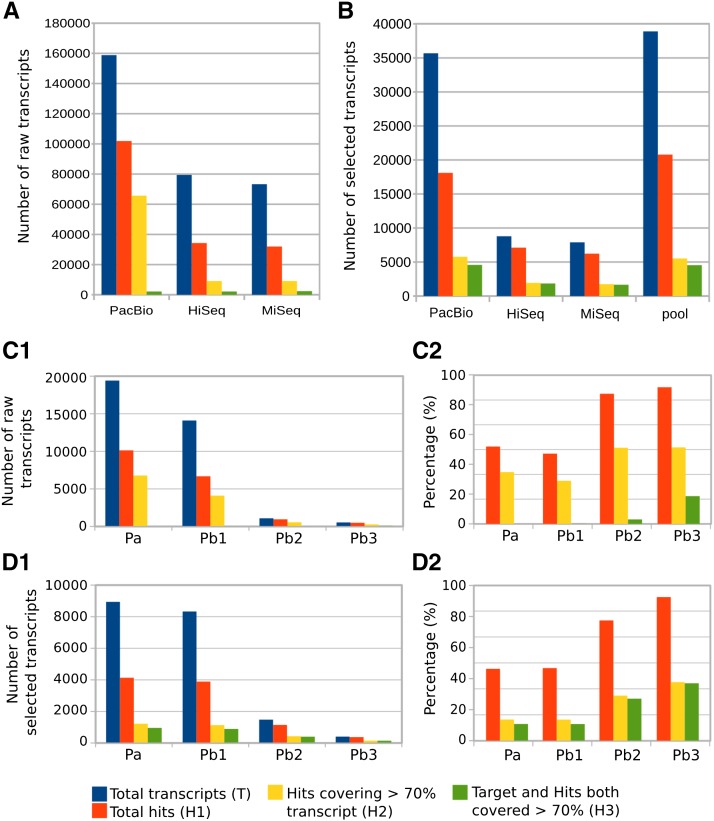
Transcript completeness analysis of different assemblies for embryo samples across the three technologies (HiSeq, MiSeq, and PacBio). Total number of sequences (T) were queried against NCBI RefSeq plant proteins by means of USEARCH-UBLAST. Three types of hits were counted: total number of hits (1H), hits covering 70% of the transcript (H2), and hits covering 70% of the transcript and 70% of the aligned protein (H3). (A) Raw assembled transcripts. (B) Sequences after transcript selection (CDS identification + clustering). (C1) Raw transcripts obtained with SMRT analysis for library Embryo_3–6 kb: transcripts identified as full-length (Pa), and set of transcripts after ICE/Quiver for isoform level clustering: consensus sequences (Pb1), low quality polished sequences (Pb2), and high quality polished sequences (Pb3). (C2) The same as C1, but expressed as percentage of sequences relative to the total number of transcripts (T). (D1) Sequences from (C1) after transcript selection (CDS identification + clustering). (D2) The same as (D1), but expressed as percentage of sequences relative to the total number of transcripts (T).

