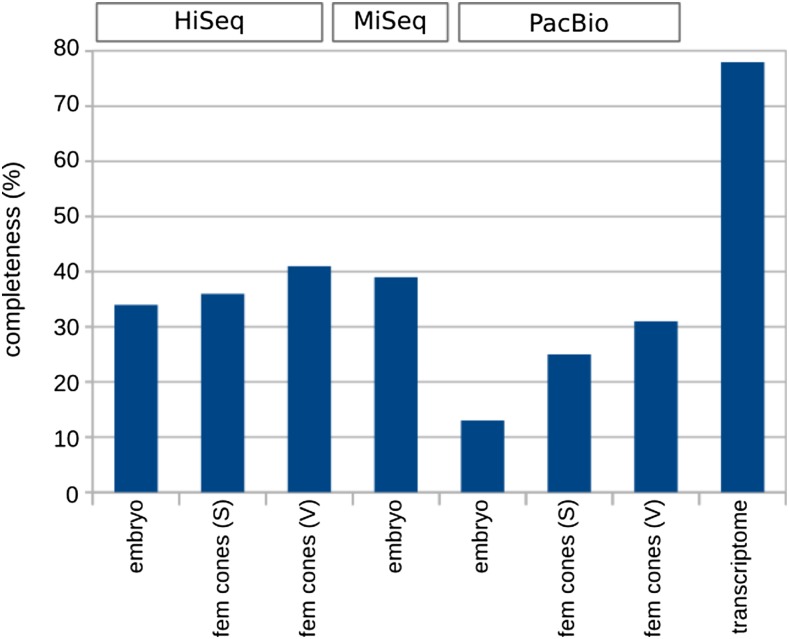
Figure 7.
Transcriptome completeness analysis by BUSCO. Transcript sequences were compared to the plant set of single-copy conserved orthologs via BUSCO to estimate the percentage of completeness. Results are shown for sample embryo, 2 cm female cones, and female cones at time of pollination (lanes 1–7), corresponding all of them to the samples used in the sequencing technology comparison. The final column reflects the complete P. lambertiana transcriptome.

