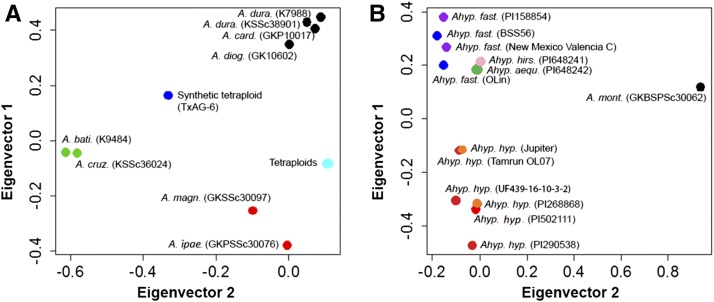
Figure 5.
PCA using SNP data. (A) Twenty-two genotypes analyzed, which included diploids and tetraploids. Dot colors mark genome affinities of accessions as follows: black dots, A-genome accessions; red dots, B-genome accessions; green dots, K-genome accessions; blue dot, synthetic amphidiploid; cyan dot, natural tetraploids. (B) Cultivated tetraploids along with Arachis monticola were analyzed with diploids omitted. Dot colors mark market types of accessions as follows: violet, valencias; blue, spanish; green, aequatoriana; red, runners; orange, virginias; pink, hirsutas; black A. monticola.

