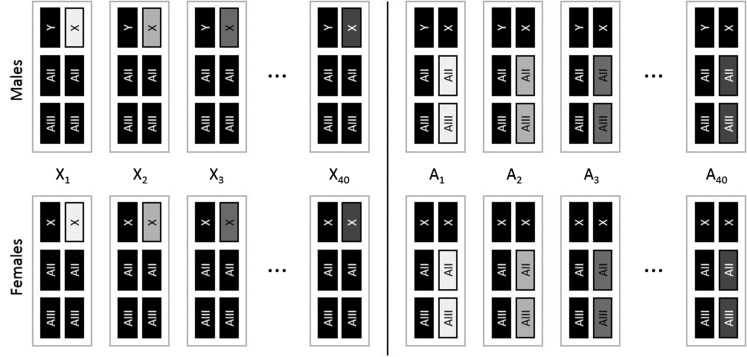
Figure 1.
Schematic of X-lines and A-lines. Gray rectangles depict cloned chromosome(s) within a line, while black rectangles depict chromosomes that vary randomly between individuals within lines. Sex chromosomes are symbolized with X and Y and the major autosomes are symbolized with AII and AIII. The fourth dot chromosome (< 1% of the genome) was not controlled in the experiment and is omitted from the figure. See Figure S1 for a detailed schematic of the line construction process.

