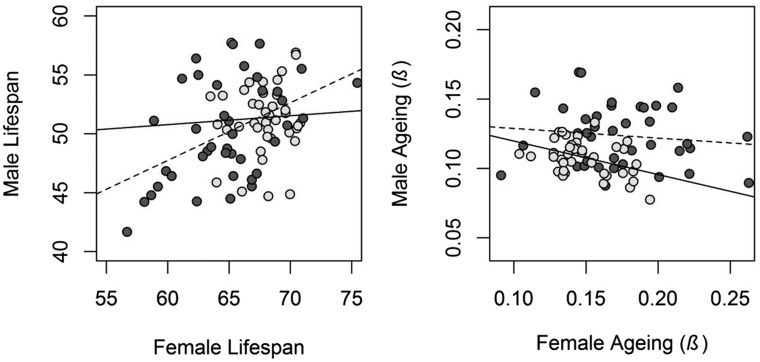
Figure 3.
Scatterplot of male and female X- and A-line means for lifespan and aging. Light gray points and solid lines represent the X chromosome, and dark gray points and dashed lines represent the autosomes. The plot is scaled such that the steepness of the regression slopes reflects the strength of the correlation.

