Figure 3.
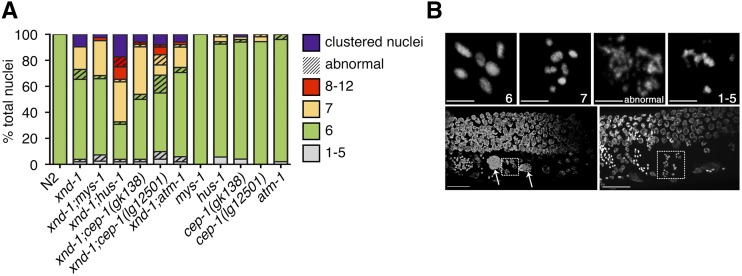
Cytological analysis and expression of select HR genes. (A) Quantification of the number of DAPI-staining bodies at diakinesis for indicated genotypes. Only the −1 oocyte was used for analysis (n = 40–52 nuclei). Color indicates the number of DAPI-staining bodies; hatched lines on top of a color indicate chromatin abnormalities. (B) Diakinesis phenotypes observed in oocytes of xnd-1 mutant animals. Shown are flattened images from a confocal Z-stack of the germ line region from DAPI-stained, whole-mount, xnd-1 mutant animals. Top row shows DNA morphologies in −1 oocytes. Scale bar, 2 µm. Bottom row shows the distal germ line on the top, proximal germ line below with sperm readily observed to the left. Large DAPI masses are marked with arrows (left); clusters of meiotic nuclei in the −2 (left) and −1 (right) oocyte positions are shown in the boxes. Normal diakinesis/diplotene nuclei can be seen in the −3 and −4 positions. Scale bar, 10 µm. DAPI, 4’,6-diamidino-2-phenylindole; HR, homologous recombination.

