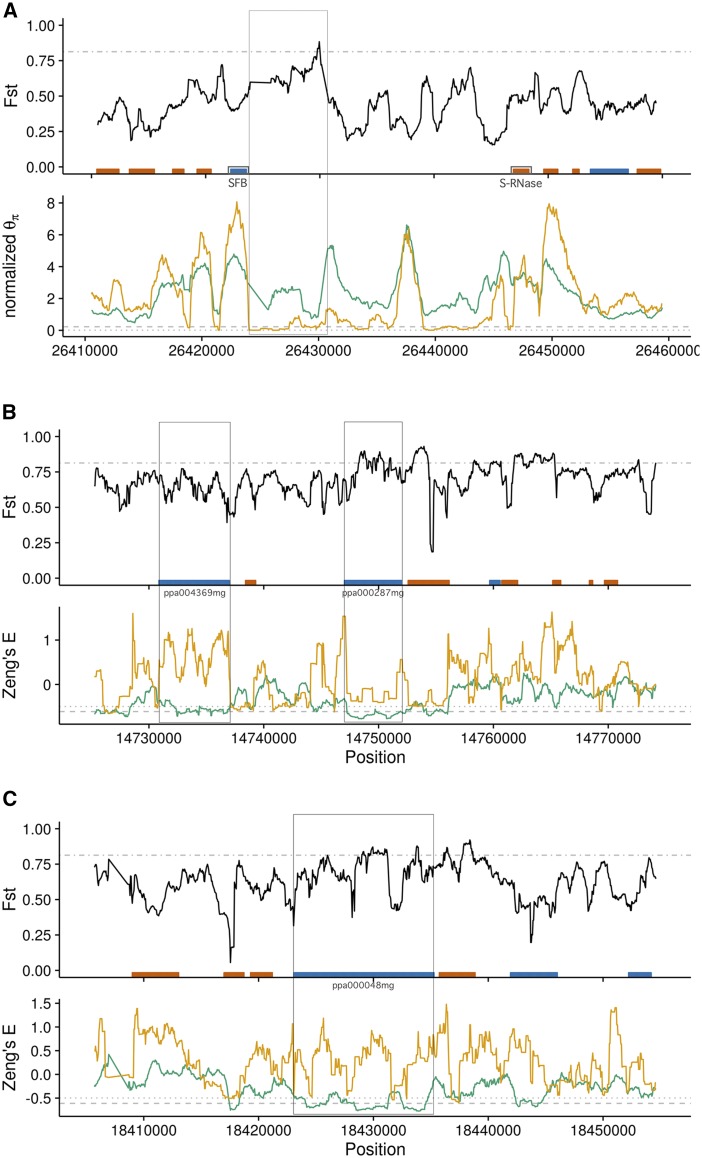
Figure 3.
Select 50 kb windows of the genome with high divergence () and either low normalized (A) or Zeng’s E (B and C) of almond (green) and peach (orange). Genes annotated in the peach reference genome are represented in the plot by boxes colored by their location on the plus strand (blue) or minus strand (red). In the plots, the gray lines indicate the upper 5% threshold, whereas in the and Zeng’s E panels the gray lines indicate the lower 5% thresholds of almond (dashed) and peach (dotted). Regions of interest, as described in the text, are boxed across adjacent panels and genes labeled. (A) S-locus divergence and diversity with S-locus genes, SFB (blue), and S-RNase (red), located on opposite sides of the central gap. Diversity in peach is drastically reduced immediately 3′ to SFB but only somewhat reduced 3′ to S-RNase, as might be expected for a linked locus. (B) and (C) Loci of interest on chromosome 3.

