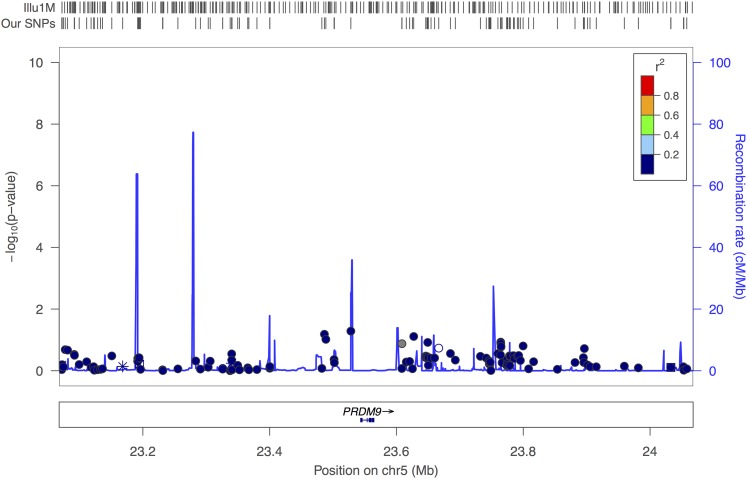
Figure 7.
PRDM9 (male and female combined analysis) in FHS dataset: this figure displays 1000 kb regions around the PRDM9 gene. In the FHS dataset, the PRDM9 gene is not covered. The SNPs are color-coded according to HapMap Phase II CEU LD pattern between SNPs presented in rectangular box in upper right corner. Known genes, and orientations are plotted below the SNPs. HapMap recombination rates has been shown with a blue line behind the SNPs. SNP coverage in FHS datasets, and Illumina 1 million chip is noted by tick marks above the plot.

