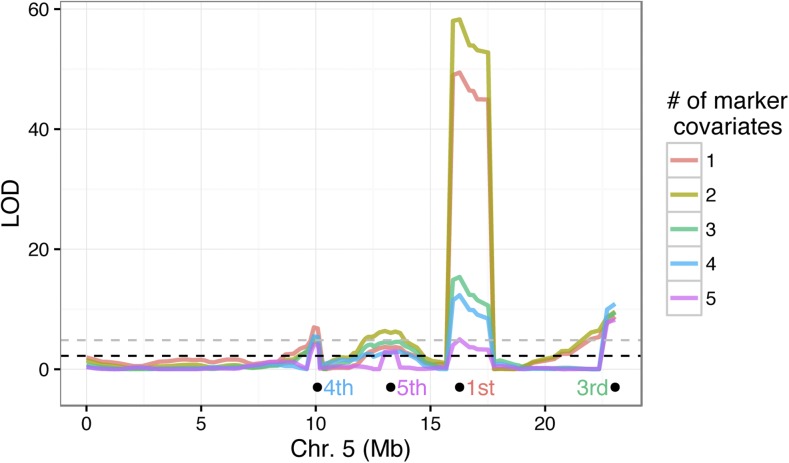
Figure 4.
Composite interval mapping of QTL on chromosome 5. The LOD profiles are shown for each CIM run with a different number of marker covariates. The location of the nth marker selected in the analysis is shown below the LOD curve and the text color coded by analysis (the second marker is the chromosome 2 QTL). The dashed lines show the significance thresholds () for the CIM model using one covariate marker (black) and five covariate markers (gray).

