
Figure 3. Blood neutrophils in S1pr4−/− mice.
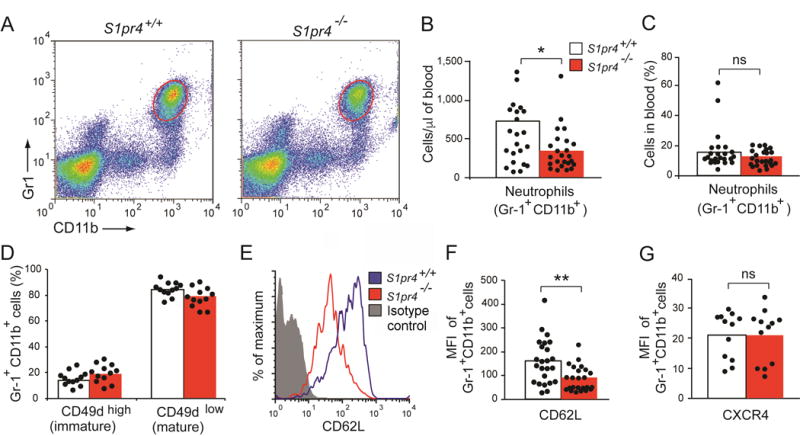
(A–C) Neutrophil numbers. Blood cells from 2–4 month–old S1pr4+/+ (n=24) and S1pr4−/− (n=24) mice were stained with anti–Gr–1 and anti–CD11b antibodies and analyzed by flow cytometry. Neutrophils were identified as Gr–1high CD11b+. Results are shown as density plots (A), as absolute numbers per μl of blood (B) and as the percentage of cells analyzed (C). (D–G) Adhesion molecule expression on blood neutrophils. Blood neutrophils from S1pr4+/+ and S1pr4−/− mice were analyzed by flow cytometry for the expression of CD49d (D), CD62L (E, F) and CXCR4 (G). Expression of CD49 is shown as percentage of Gr1+ CD11b+ CD49high (immature neutrophils) and Gr1+ CD11b+ CD49low (mature neutrophils) (D). Expression of CD62L (F) and CXCR4 (G) on Gr1+ CD11b+ cells are shown as mean fluorescence intensity (MFI). Representative histogram analysis showing the CD62L expression for S1pr4+/+ neutrophils (blue line), S1pr4−/− neutrophils (red line) and the corresponding isotype control staining (green line) (E). The bars represent mean values, and the closed circles are individual mice. S1pr4+/+ (open bars) and S1pr4−/− (red bars). Student’s t test *p < 0.05; **p < 0.01; ns, not significant.