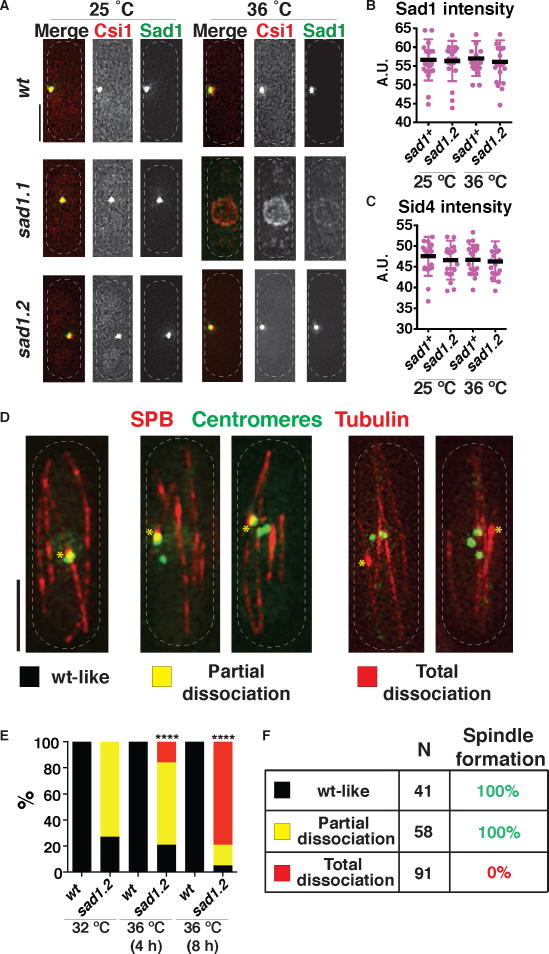
Figure 3. Complete centromere dissociation from the LINC complex during interphase results in spindle failure.
(A–C) The SPB remains intact in sad1.2 cells at restrictive temperature. (A) Csi1 localization is abolished in sad1.1 cells but unaltered in sad1.2 cells. Endogenously tagged Csi1-mCherry imaged after 8 h at 36 °C. (B–C) Signal intensities at the SPB during mitotic interphase; n=20 for each genotype. Error bars = standard deviations. (D) Centromere-LINC association patterns during sad1.2 interphase. Tags as in Figure 1; centromeres imaged via endogenously tagged Mis6-GFP. (E) Progressive increase in total centromere-LINC dissociation at 36°C. 100 cells were scored for each condition over more than five independent experiments. Scoring began four frames prior to SPB duplication, with frames taken every 10 min. Mean is shown with bars whose colors correspond to the categories defined in (D). p values were determined by Fisher’s exact test (**** = p < 0.0001). (F) In 100% of cells harboring one or more centromere-LINC association, proper spindle formation is seen. In contrast, total centromere-LINC dissociation completely abolishes spindle formation. 41, 58 and 91 cells analyzed for wt-like, partial and total dissociation categories, respectively, from ≥10 independent experiments. Identical results were obtained using other kinetochore markers, again scoring hundreds of cells in ≥10 independent experiments; see Figure S4.

