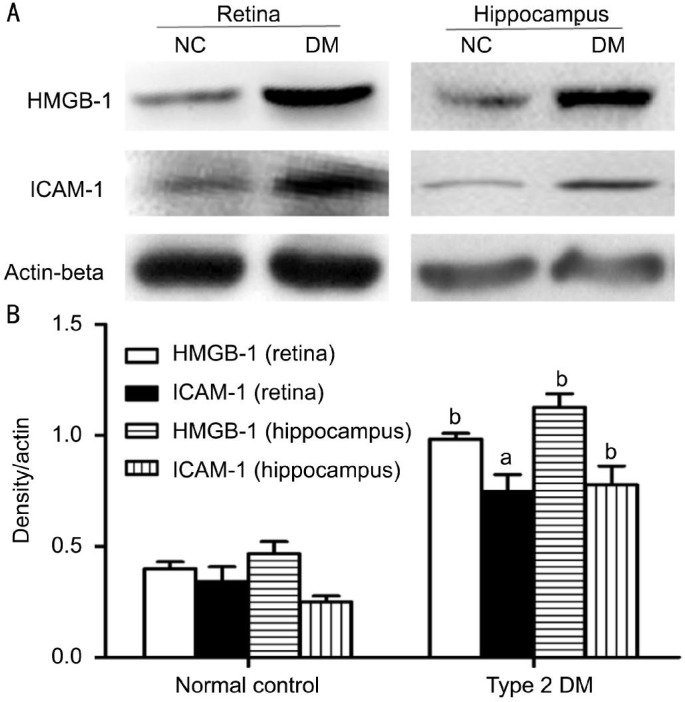
Figure 4. Protein expression of HMGB-1 and ICAM-1 in rat retina and hippocampus.
A: Representative Western blot showing the protein expression of HMGB-1 and ICAM-1 in rat retina and hippocampus. Equal amounts of proteins were loaded and Actin-beta was used as a loading control, n=4 experiments; B: Column diagrams and bars representing the ratio of the scanned immunoblots of HMGB-1 and ICAM-1 to that of Actin-beta. Data are shown as mean±SD, n=4 experiments, aP<0.05 vs normal control, bP<0.01 vs normal control.

