
Figure 1.
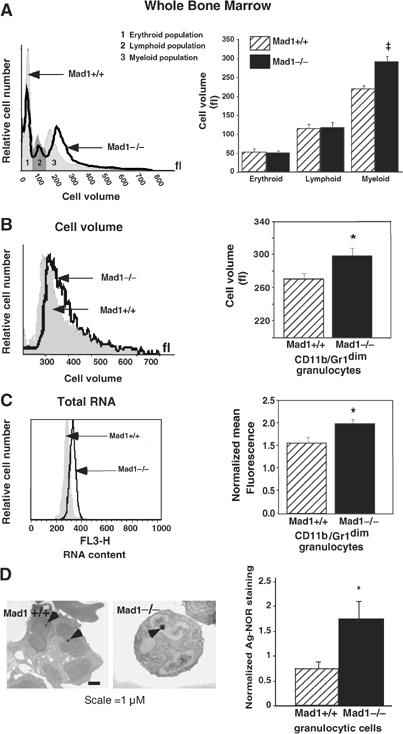
MAD1 regulates cell growth during granulocyte differentiation. (A) Representative cell volume profiles (left) and pooled data (right) of whole bone marrow cells from wild-type (WT; Mad1+/+) and Mad1-null (Mad1−/−) mice were determined using a Sysmex CDA500 system. Results are the mean±s.e.m. from four WT and seven Mad1−/− mice. ‡P=0.002 compared to cells from WT mice. (B) Immature granulocytes (CD11b/Gr-1dim staining) were purified from WT and Mad1−/− mouse bone marrow using FACS as described (Walkley et al, 2002). Representative cell volume profiles (left) and pooled data (right) of granulocytes (n=4 for each genotype) are shown. *P<0.05 compared to cells from WT mice. (C) Total RNA content of immature granulocytes in the G0/G1 phase of the cell cycle. Cell populations were purified as in (B), stained for RNA and DNA content using acridine orange and gated on G0/G1. Representative RNA staining profiles (left) and pooled data (right) of granulocytes (n=4 WT, 6 Mad1−/−) are shown. *P<0.05 compared to WT mice. (D) Size of granulocytic nucleoli from WT and Mad1−/− mice as demonstrated by Ag-NOR staining. Arrowheads point to nucleolar regions of granulocytes (left). Total area of Ag-NOR-stained nucleoli was calculated (right) (n=10 WT, 20 Mad1−/−). *P<0.05 compared to WT mice.