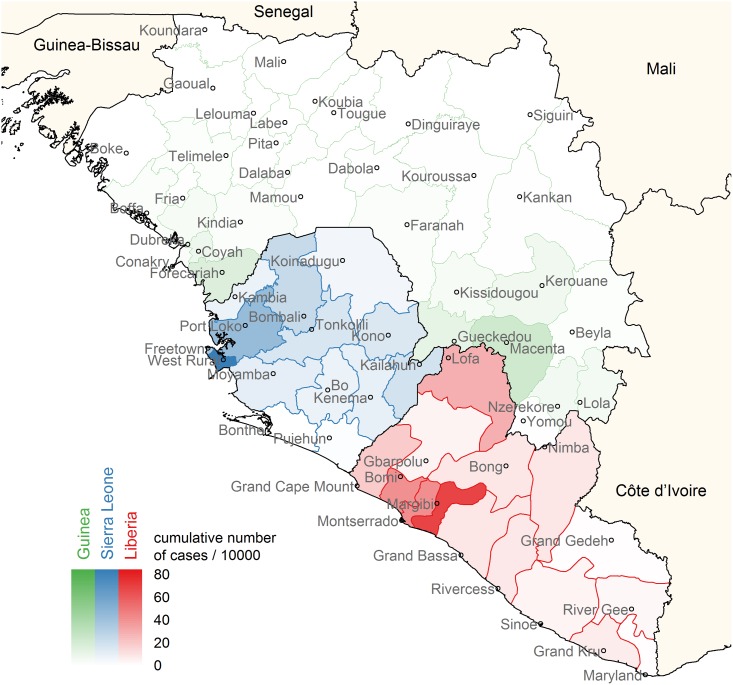
Fig 1. Cumulative incidence map of Guinea, Sierra Leone and Liberia.
Cumulative number of cases per 10000 people in each district of Guinea (green), Sierra Leone (blue) and Liberia (red), over the period December 2013—June 2015. For each district, the location of the most populous city is indicated on the map and used in the analysis. These incidences are the averages over ten augmented data sets to include suspected, probable and confirmed cases.

