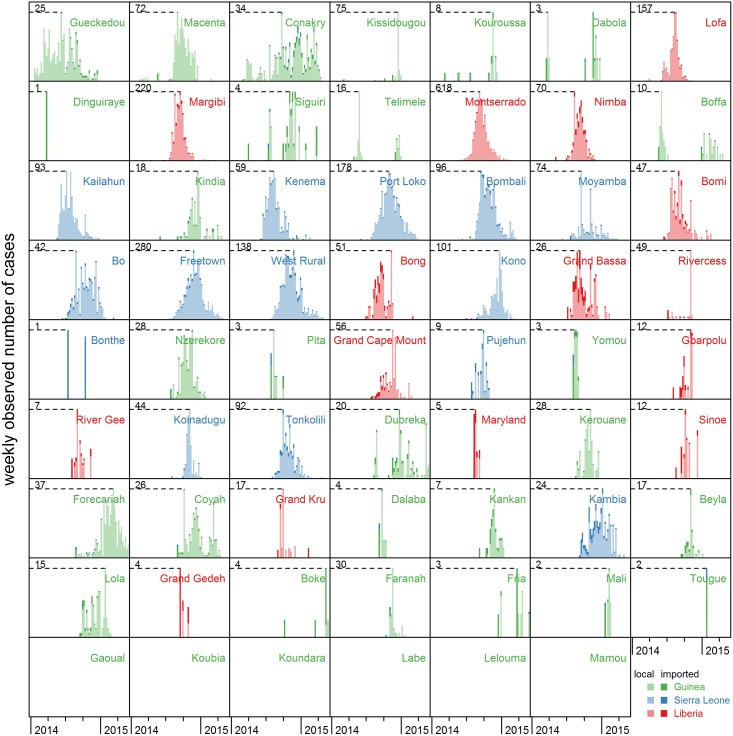
Fig 3. Observed incidence over time per district, classified by origin of cases.
Weekly observed incidence in all districts of Guinea (green), Sierra Leone (blue) and Liberia (red), based on median posterior values averaged over ten augmented data sets. A distinction is made between locally generated cases (lightly coloured bar), imported cases from another district in the same country (dark tip of same colour), and imported cases from another country (dark tip of different colour). Districts are ordered by time of first observed case; in six districts in Guinea not a single case has been observed. Note that the y-axis scale depends on the maximal number of observed cases per week in a district, ranging from 1 (Dinguiraye, Guinea) to 618 (Montserrado, Liberia).

