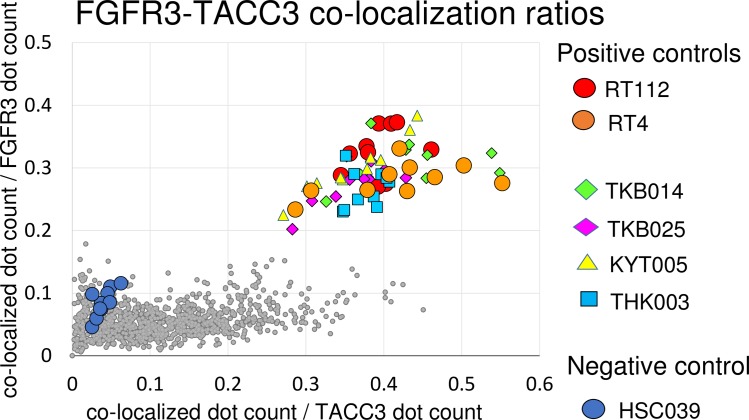
Fig 5. Detection of FGFR3-TACC3 fusion genes in FFPE clinical samples by RNA-FISH.
Scatter diagram of FGFR3-TACC3 co-localization ratios of 10 non-overlapping fields for each sample. The number of co-localized signals was divided by the number of FGFR3 signals and TACC3 signals, and the quotients were plotted in Y- and X-axis, respectively. Four samples in the right upper quadrant were thought to be fusion positive by RNA-FISH, and were confirmed as fusion positive by RT-PCR analysis. Small gray dots represent cases that were thought to be negative for the fusion gene.

